Nonimmigrants Unemployment Among Women with Children Ages 6 to 17 years
COMPARE
Nonimmigrants
Select to Compare
Unemployment Among Women with Children Ages 6 to 17 years
Nonimmigrants Unemployment Among Women with Children Ages 6 to 17 years
10.0%
UNEMPLOYMENT | WOMEN W/ CHILDREN 6 TO 17
0.0/ 100
METRIC RATING
291st/ 347
METRIC RANK
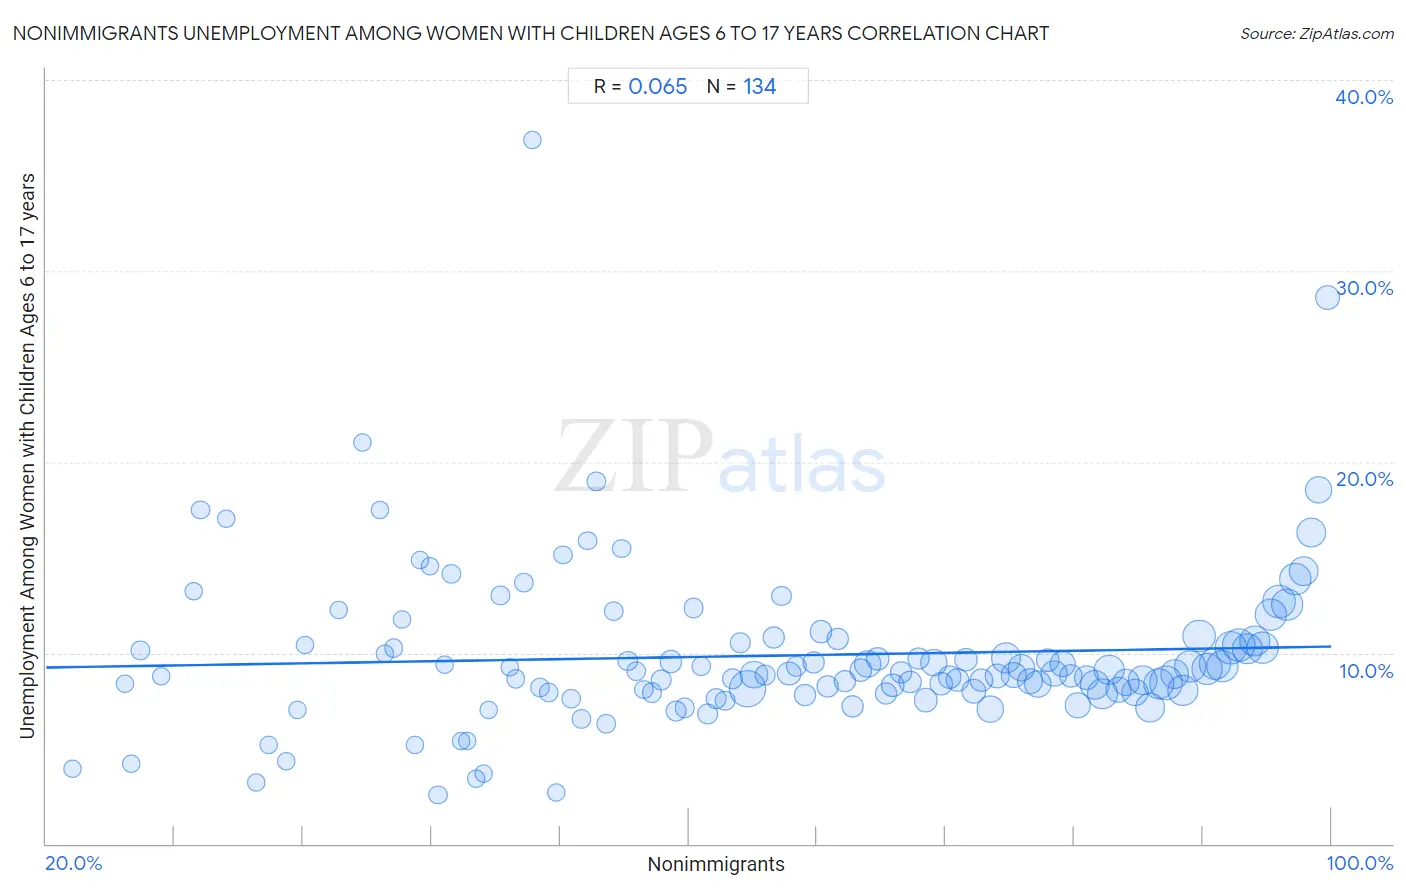
Nonimmigrants Unemployment Among Women with Children Ages 6 to 17 years Correlation Chart
The statistical analysis conducted on geographies consisting of 361,515,464 people shows a slight positive correlation between the proportion of Nonimmigrants and unemployment rate among women with children between the ages 6 and 17 in the United States with a correlation coefficient (R) of 0.065 and weighted average of 10.0%. On average, for every 1% (one percent) increase in Nonimmigrants within a typical geography, there is an increase of 0.014% in unemployment rate among women with children between the ages 6 and 17.
It is essential to understand that the correlation between the percentage of Nonimmigrants and unemployment rate among women with children between the ages 6 and 17 does not imply a direct cause-and-effect relationship. It remains uncertain whether the presence of Nonimmigrants influences an upward or downward trend in the level of unemployment rate among women with children between the ages 6 and 17 within an area, or if Nonimmigrants simply ended up residing in those areas with higher or lower levels of unemployment rate among women with children between the ages 6 and 17 due to other factors.
Demographics Similar to Nonimmigrants by Unemployment Among Women with Children Ages 6 to 17 years
In terms of unemployment among women with children ages 6 to 17 years, the demographic groups most similar to Nonimmigrants are Carpatho Rusyn (10.0%, a difference of 0.010%), Subsaharan African (10.0%, a difference of 0.020%), Honduran (10.0%, a difference of 0.040%), Haitian (10.0%, a difference of 0.10%), and Ecuadorian (10.0%, a difference of 0.19%).
| Demographics | Rating | Rank | Unemployment Among Women with Children Ages 6 to 17 years |
| Yakama | 0.0 /100 | #284 | Tragic 9.9% |
| Hispanics or Latinos | 0.0 /100 | #285 | Tragic 9.9% |
| Choctaw | 0.0 /100 | #286 | Tragic 9.9% |
| Sierra Leoneans | 0.0 /100 | #287 | Tragic 9.9% |
| Shoshone | 0.0 /100 | #288 | Tragic 10.0% |
| Hondurans | 0.0 /100 | #289 | Tragic 10.0% |
| Sub-Saharan Africans | 0.0 /100 | #290 | Tragic 10.0% |
| Nonimmigrants | 0.0 /100 | #291 | Tragic 10.0% |
| Carpatho Rusyns | 0.0 /100 | #292 | Tragic 10.0% |
| Haitians | 0.0 /100 | #293 | Tragic 10.0% |
| Ecuadorians | 0.0 /100 | #294 | Tragic 10.0% |
| Cherokee | 0.0 /100 | #295 | Tragic 10.0% |
| Immigrants from Western Africa | 0.0 /100 | #296 | Tragic 10.1% |
| Immigrants from Caribbean | 0.0 /100 | #297 | Tragic 10.1% |
| Immigrants from Haiti | 0.0 /100 | #298 | Tragic 10.1% |
Nonimmigrants Unemployment Among Women with Children Ages 6 to 17 years Correlation Summary
| Measurement | Nonimmigrants Data | Unemployment Among Women with Children Ages 6 to 17 years Data |
| Minimum | 21.6% | 2.6% |
| Maximum | 99.8% | 36.8% |
| Range | 78.1% | 34.3% |
| Mean | 65.9% | 9.9% |
| Median | 66.5% | 8.9% |
| Interquartile 25% (IQ1) | 49.7% | 8.0% |
| Interquartile 75% (IQ3) | 83.3% | 10.5% |
| Interquartile Range (IQR) | 33.6% | 2.5% |
| Standard Deviation (Sample) | 20.5% | 4.3% |
| Standard Deviation (Population) | 20.4% | 4.3% |
Correlation Details
| Nonimmigrants Percentile | Sample Size | Unemployment Among Women with Children Ages 6 to 17 years |
[ 21.5% - 22.0% ] 21.63% | 42,081 | 3.9% |
[ 24.5% - 25.0% ] 24.90% | 71,088 | 8.4% |
[ 25.0% - 25.5% ] 25.32% | 46,798 | 4.2% |
[ 25.5% - 26.0% ] 25.85% | 257,738 | 10.1% |
[ 27.0% - 27.5% ] 27.15% | 57,066 | 8.8% |
[ 29.0% - 29.5% ] 29.14% | 88,484 | 13.2% |
[ 29.5% - 30.0% ] 29.61% | 115,169 | 17.5% |
[ 31.0% - 31.5% ] 31.19% | 64,751 | 17.0% |
[ 33.0% - 33.5% ] 33.09% | 52,851 | 3.2% |
[ 33.5% - 34.0% ] 33.83% | 152,851 | 5.2% |
[ 34.5% - 35.0% ] 34.93% | 48,096 | 4.3% |
[ 35.5% - 36.0% ] 35.67% | 109,357 | 7.0% |
[ 36.0% - 36.5% ] 36.13% | 55,241 | 10.4% |
[ 38.0% - 38.5% ] 38.17% | 74,796 | 12.2% |
[ 39.5% - 40.0% ] 39.66% | 112,750 | 21.0% |
[ 40.5% - 41.0% ] 40.81% | 85,384 | 17.5% |
[ 41.0% - 41.5% ] 41.10% | 148,144 | 10.0% |
[ 41.5% - 42.0% ] 41.66% | 90,567 | 10.2% |
[ 42.0% - 42.5% ] 42.14% | 535,842 | 11.7% |
[ 42.5% - 43.0% ] 42.94% | 64,268 | 5.2% |
[ 43.0% - 43.5% ] 43.24% | 30,509 | 14.8% |
[ 43.5% - 44.0% ] 43.86% | 80,460 | 14.5% |
[ 44.0% - 44.5% ] 44.39% | 146,820 | 2.6% |
[ 44.5% - 45.0% ] 44.81% | 401,537 | 9.4% |
[ 45.0% - 45.5% ] 45.23% | 558,486 | 14.2% |
[ 45.5% - 46.0% ] 45.80% | 242,423 | 5.4% |
[ 46.0% - 46.5% ] 46.22% | 375,491 | 5.4% |
[ 46.5% - 47.0% ] 46.77% | 107,799 | 3.4% |
[ 47.0% - 47.5% ] 47.20% | 195,957 | 3.6% |
[ 47.5% - 48.0% ] 47.57% | 100,373 | 7.0% |
[ 48.0% - 48.5% ] 48.28% | 229,847 | 13.0% |
[ 48.5% - 49.0% ] 48.85% | 273,387 | 9.2% |
[ 49.0% - 49.5% ] 49.23% | 603,168 | 8.6% |
[ 49.5% - 50.0% ] 49.71% | 577,972 | 13.7% |
[ 50.0% - 50.5% ] 50.30% | 67,916 | 36.8% |
[ 50.5% - 51.0% ] 50.73% | 711,173 | 8.2% |
[ 51.0% - 51.5% ] 51.26% | 731,531 | 7.9% |
[ 51.5% - 52.0% ] 51.77% | 48,454 | 2.7% |
[ 52.0% - 52.5% ] 52.18% | 158,385 | 15.1% |
[ 52.5% - 53.0% ] 52.71% | 718,563 | 7.6% |
[ 53.0% - 53.5% ] 53.31% | 512,360 | 6.5% |
[ 53.5% - 54.0% ] 53.70% | 587,034 | 15.9% |
[ 54.0% - 54.5% ] 54.25% | 578,149 | 19.0% |
[ 54.5% - 55.0% ] 54.87% | 696,750 | 6.3% |
[ 55.0% - 55.5% ] 55.30% | 763,438 | 12.2% |
[ 55.5% - 56.0% ] 55.81% | 279,910 | 15.5% |
[ 56.0% - 56.5% ] 56.22% | 994,617 | 9.6% |
[ 56.5% - 57.0% ] 56.75% | 703,351 | 9.0% |
[ 57.0% - 57.5% ] 57.21% | 539,548 | 8.1% |
[ 57.5% - 58.0% ] 57.70% | 1,244,822 | 7.9% |
[ 58.0% - 58.5% ] 58.27% | 1,348,561 | 8.6% |
[ 58.5% - 59.0% ] 58.90% | 2,385,576 | 9.5% |
[ 59.0% - 59.5% ] 59.23% | 1,523,829 | 6.9% |
[ 59.5% - 60.0% ] 59.77% | 1,006,633 | 7.1% |
[ 60.0% - 60.5% ] 60.32% | 864,765 | 12.3% |
[ 60.5% - 61.0% ] 60.75% | 732,051 | 9.3% |
[ 61.0% - 61.5% ] 61.20% | 1,195,758 | 6.8% |
[ 61.5% - 62.0% ] 61.74% | 1,432,434 | 7.6% |
[ 62.0% - 62.5% ] 62.25% | 1,237,039 | 7.5% |
[ 62.5% - 63.0% ] 62.74% | 1,333,962 | 8.7% |
[ 63.0% - 63.5% ] 63.21% | 1,086,888 | 10.5% |
[ 63.5% - 64.0% ] 63.68% | 10,027,939 | 8.1% |
[ 64.0% - 64.5% ] 64.08% | 5,032,071 | 8.9% |
[ 64.5% - 65.0% ] 64.74% | 1,228,581 | 8.8% |
[ 65.0% - 65.5% ] 65.27% | 2,031,834 | 10.8% |
[ 65.5% - 66.0% ] 65.78% | 1,064,704 | 13.0% |
[ 66.0% - 66.5% ] 66.25% | 2,935,676 | 8.9% |
[ 66.5% - 67.0% ] 66.72% | 1,285,141 | 9.3% |
[ 67.0% - 67.5% ] 67.25% | 1,968,378 | 7.8% |
[ 67.5% - 68.0% ] 67.77% | 2,112,415 | 9.5% |
[ 68.0% - 68.5% ] 68.24% | 2,281,883 | 11.1% |
[ 68.5% - 69.0% ] 68.67% | 1,863,814 | 8.2% |
[ 69.0% - 69.5% ] 69.25% | 1,792,716 | 10.7% |
[ 69.5% - 70.0% ] 69.74% | 2,103,655 | 8.5% |
[ 70.0% - 70.5% ] 70.23% | 1,961,734 | 7.2% |
[ 70.5% - 71.0% ] 70.71% | 2,538,004 | 9.1% |
[ 71.0% - 71.5% ] 71.12% | 4,512,163 | 9.4% |
[ 71.5% - 72.0% ] 71.77% | 2,565,224 | 9.7% |
[ 72.0% - 72.5% ] 72.28% | 2,286,930 | 7.9% |
[ 72.5% - 73.0% ] 72.71% | 2,433,469 | 8.3% |
[ 73.0% - 73.5% ] 73.25% | 2,170,347 | 9.0% |
[ 73.5% - 74.0% ] 73.77% | 2,616,490 | 8.5% |
[ 74.0% - 74.5% ] 74.32% | 2,282,597 | 9.7% |
[ 74.5% - 75.0% ] 74.76% | 3,229,365 | 7.5% |
[ 75.0% - 75.5% ] 75.24% | 4,598,615 | 9.5% |
[ 75.5% - 76.0% ] 75.71% | 2,758,987 | 8.4% |
[ 76.0% - 76.5% ] 76.23% | 3,070,646 | 8.7% |
[ 76.5% - 77.0% ] 76.76% | 2,732,204 | 8.6% |
[ 77.0% - 77.5% ] 77.28% | 2,994,616 | 9.6% |
[ 77.5% - 78.0% ] 77.78% | 3,346,835 | 8.0% |
[ 78.0% - 78.5% ] 78.25% | 2,530,330 | 8.6% |
[ 78.5% - 79.0% ] 78.79% | 4,364,810 | 7.1% |
[ 79.0% - 79.5% ] 79.23% | 3,671,412 | 8.8% |
[ 79.5% - 80.0% ] 79.73% | 6,298,423 | 9.7% |
[ 80.0% - 80.5% ] 80.27% | 4,013,597 | 8.8% |
[ 80.5% - 81.0% ] 80.72% | 4,497,036 | 9.2% |
[ 81.0% - 81.5% ] 81.21% | 4,047,692 | 8.5% |
[ 81.5% - 82.0% ] 81.74% | 4,390,180 | 8.4% |
[ 82.0% - 82.5% ] 82.32% | 2,485,331 | 9.6% |
[ 82.5% - 83.0% ] 82.74% | 4,262,769 | 8.9% |
[ 83.0% - 83.5% ] 83.29% | 3,807,913 | 9.4% |
[ 83.5% - 84.0% ] 83.79% | 3,076,762 | 8.8% |
[ 84.0% - 84.5% ] 84.23% | 3,743,366 | 7.2% |
[ 84.5% - 85.0% ] 84.78% | 3,189,783 | 8.7% |
[ 85.0% - 85.5% ] 85.28% | 6,229,770 | 8.3% |
[ 85.5% - 86.0% ] 85.76% | 6,715,940 | 7.9% |
[ 86.0% - 86.5% ] 86.18% | 6,213,925 | 9.1% |
[ 86.5% - 87.0% ] 86.74% | 4,291,289 | 8.1% |
[ 87.0% - 87.5% ] 87.26% | 4,820,652 | 8.5% |
[ 87.5% - 88.0% ] 87.81% | 4,771,519 | 7.9% |
[ 88.0% - 88.5% ] 88.24% | 5,801,045 | 8.6% |
[ 88.5% - 89.0% ] 88.75% | 5,907,971 | 7.1% |
[ 89.0% - 89.5% ] 89.26% | 6,668,471 | 8.4% |
[ 89.5% - 90.0% ] 89.73% | 8,290,882 | 8.4% |
[ 90.0% - 90.5% ] 90.23% | 5,713,008 | 8.9% |
[ 90.5% - 91.0% ] 90.75% | 6,298,274 | 8.0% |
[ 91.0% - 91.5% ] 91.24% | 7,186,978 | 9.3% |
[ 91.5% - 92.0% ] 91.76% | 7,618,240 | 10.9% |
[ 92.0% - 92.5% ] 92.26% | 7,183,089 | 9.1% |
[ 92.5% - 93.0% ] 92.75% | 7,382,929 | 9.4% |
[ 93.0% - 93.5% ] 93.25% | 7,431,912 | 9.3% |
[ 93.5% - 94.0% ] 93.76% | 7,739,616 | 10.3% |
[ 94.0% - 94.5% ] 94.25% | 7,977,507 | 10.4% |
[ 94.5% - 95.0% ] 94.75% | 6,717,746 | 10.2% |
[ 95.0% - 95.5% ] 95.25% | 6,970,034 | 10.6% |
[ 95.5% - 96.0% ] 95.75% | 7,187,993 | 10.3% |
[ 96.0% - 96.5% ] 96.25% | 7,743,994 | 12.0% |
[ 96.5% - 97.0% ] 96.75% | 7,704,598 | 12.7% |
[ 97.0% - 97.5% ] 97.26% | 7,755,485 | 12.5% |
[ 97.5% - 98.0% ] 97.75% | 7,004,196 | 13.9% |
[ 98.0% - 98.5% ] 98.25% | 6,133,676 | 14.3% |
[ 98.5% - 99.0% ] 98.73% | 5,997,404 | 16.3% |
[ 99.0% - 99.5% ] 99.23% | 4,881,009 | 18.5% |
[ 99.5% - 100.0% ] 99.78% | 3,288,827 | 28.6% |