Nonimmigrants Male Disability
COMPARE
Nonimmigrants
Select to Compare
Male Disability
Nonimmigrants Male Disability
12.9%
DISABILITY | MALES
0.0/ 100
METRIC RATING
296th/ 347
METRIC RANK
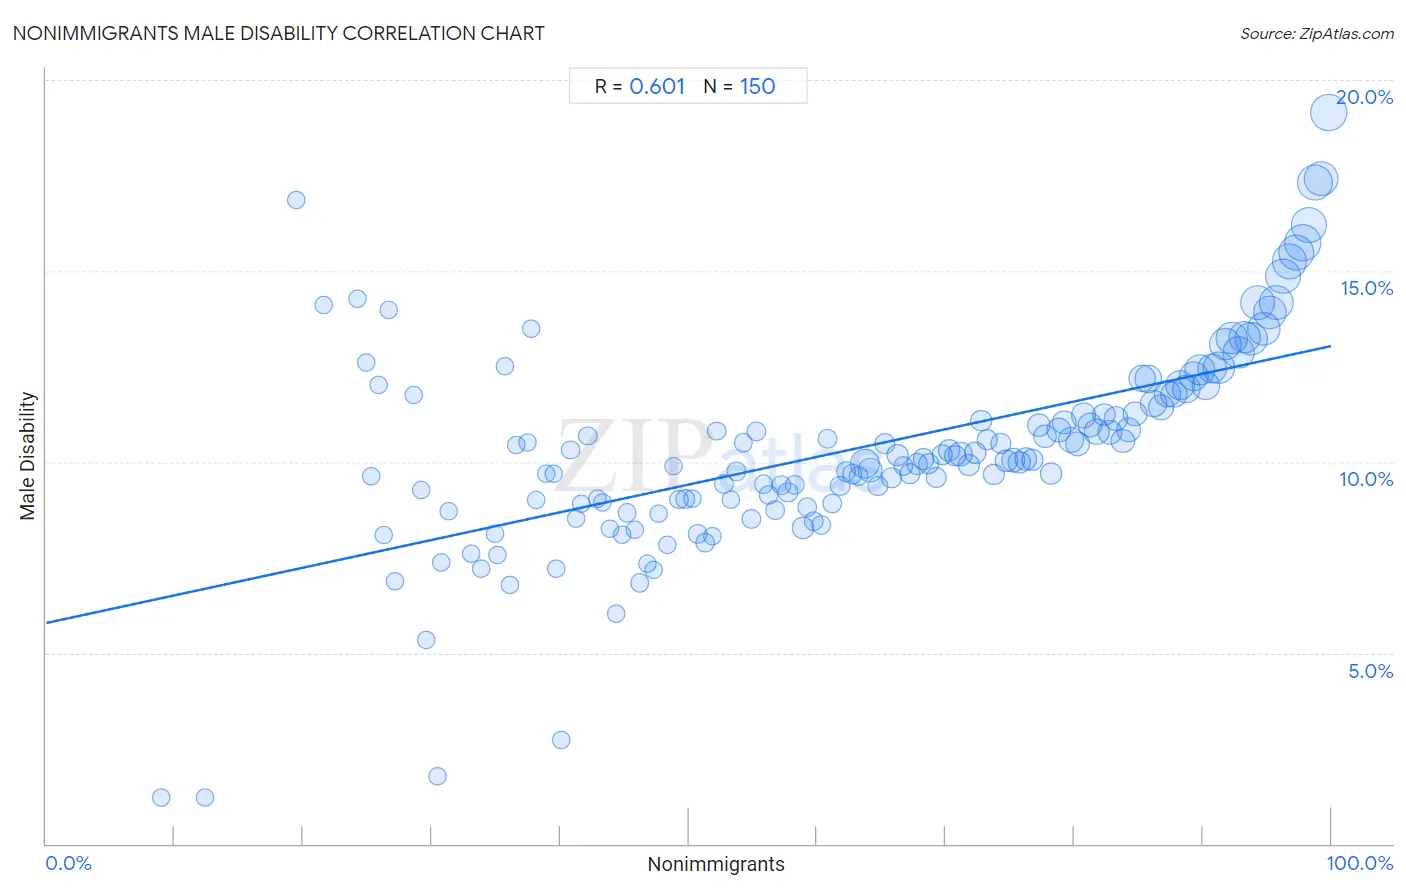
Nonimmigrants Male Disability Correlation Chart
The statistical analysis conducted on geographies consisting of 584,663,642 people shows a significant positive correlation between the proportion of Nonimmigrants and percentage of males with a disability in the United States with a correlation coefficient (R) of 0.601 and weighted average of 12.9%. On average, for every 1% (one percent) increase in Nonimmigrants within a typical geography, there is an increase of 0.073% in percentage of males with a disability.
It is essential to understand that the correlation between the percentage of Nonimmigrants and percentage of males with a disability does not imply a direct cause-and-effect relationship. It remains uncertain whether the presence of Nonimmigrants influences an upward or downward trend in the level of percentage of males with a disability within an area, or if Nonimmigrants simply ended up residing in those areas with higher or lower levels of percentage of males with a disability due to other factors.
Demographics Similar to Nonimmigrants by Male Disability
In terms of male disability, the demographic groups most similar to Nonimmigrants are Immigrants from Micronesia (12.9%, a difference of 0.070%), Inupiat (13.0%, a difference of 0.11%), Marshallese (12.9%, a difference of 0.16%), Pennsylvania German (13.0%, a difference of 0.31%), and Yaqui (12.9%, a difference of 0.40%).
| Demographics | Rating | Rank | Male Disability |
| Immigrants from Cabo Verde | 0.0 /100 | #289 | Tragic 12.8% |
| Pima | 0.0 /100 | #290 | Tragic 12.8% |
| Whites/Caucasians | 0.0 /100 | #291 | Tragic 12.8% |
| English | 0.0 /100 | #292 | Tragic 12.8% |
| Yaqui | 0.0 /100 | #293 | Tragic 12.9% |
| Marshallese | 0.0 /100 | #294 | Tragic 12.9% |
| Immigrants from Micronesia | 0.0 /100 | #295 | Tragic 12.9% |
| Nonimmigrants | 0.0 /100 | #296 | Tragic 12.9% |
| Inupiat | 0.0 /100 | #297 | Tragic 13.0% |
| Pennsylvania Germans | 0.0 /100 | #298 | Tragic 13.0% |
| Celtics | 0.0 /100 | #299 | Tragic 13.0% |
| Cheyenne | 0.0 /100 | #300 | Tragic 13.0% |
| French | 0.0 /100 | #301 | Tragic 13.0% |
| Crow | 0.0 /100 | #302 | Tragic 13.1% |
| Scotch-Irish | 0.0 /100 | #303 | Tragic 13.2% |
Nonimmigrants Male Disability Correlation Summary
| Measurement | Nonimmigrants Data | Male Disability Data |
| Minimum | 8.9% | 1.2% |
| Maximum | 99.8% | 19.2% |
| Range | 90.9% | 18.0% |
| Mean | 62.0% | 10.3% |
| Median | 62.5% | 10.0% |
| Interquartile 25% (IQ1) | 43.8% | 8.9% |
| Interquartile 75% (IQ3) | 81.2% | 11.5% |
| Interquartile Range (IQR) | 37.4% | 2.6% |
| Standard Deviation (Sample) | 22.6% | 2.7% |
| Standard Deviation (Population) | 22.5% | 2.7% |
Correlation Details
| Nonimmigrants Percentile | Sample Size | Male Disability |
[ 8.5% - 9.0% ] 8.93% | 112 | 1.2% |
[ 12.0% - 12.5% ] 12.37% | 97 | 1.2% |
[ 19.0% - 19.5% ] 19.42% | 1,030 | 16.8% |
[ 21.5% - 22.0% ] 21.63% | 42,081 | 14.1% |
[ 24.0% - 24.5% ] 24.26% | 1,018 | 14.3% |
[ 24.5% - 25.0% ] 24.90% | 71,088 | 12.6% |
[ 25.0% - 25.5% ] 25.32% | 46,798 | 9.6% |
[ 25.5% - 26.0% ] 25.85% | 257,738 | 12.0% |
[ 26.0% - 26.5% ] 26.25% | 19,399 | 8.1% |
[ 26.5% - 27.0% ] 26.69% | 29,830 | 14.0% |
[ 27.0% - 27.5% ] 27.15% | 57,066 | 6.9% |
[ 28.5% - 29.0% ] 28.63% | 45,620 | 11.8% |
[ 29.0% - 29.5% ] 29.21% | 138,182 | 9.3% |
[ 29.5% - 30.0% ] 29.61% | 115,169 | 5.3% |
[ 30.0% - 30.5% ] 30.42% | 766 | 1.8% |
[ 30.5% - 31.0% ] 30.74% | 90,791 | 7.4% |
[ 31.0% - 31.5% ] 31.32% | 119,624 | 8.7% |
[ 33.0% - 33.5% ] 33.09% | 109,218 | 7.6% |
[ 33.5% - 34.0% ] 33.83% | 152,851 | 7.2% |
[ 34.5% - 35.0% ] 34.90% | 53,206 | 8.1% |
[ 35.0% - 35.5% ] 35.12% | 105,802 | 7.6% |
[ 35.5% - 36.0% ] 35.67% | 109,357 | 12.5% |
[ 36.0% - 36.5% ] 36.10% | 117,893 | 6.8% |
[ 36.5% - 37.0% ] 36.58% | 26,777 | 10.5% |
[ 37.0% - 37.5% ] 37.42% | 26,090 | 10.5% |
[ 37.5% - 38.0% ] 37.72% | 93,984 | 13.5% |
[ 38.0% - 38.5% ] 38.12% | 128,876 | 9.0% |
[ 38.5% - 39.0% ] 38.87% | 58,079 | 9.7% |
[ 39.0% - 39.5% ] 39.47% | 36,392 | 9.7% |
[ 39.5% - 40.0% ] 39.70% | 154,064 | 7.2% |
[ 40.0% - 40.5% ] 40.08% | 15,852 | 2.7% |
[ 40.5% - 41.0% ] 40.81% | 86,935 | 10.3% |
[ 41.0% - 41.5% ] 41.20% | 221,458 | 8.5% |
[ 41.5% - 42.0% ] 41.66% | 98,125 | 8.9% |
[ 42.0% - 42.5% ] 42.16% | 598,156 | 10.7% |
[ 42.5% - 43.0% ] 42.87% | 110,508 | 9.0% |
[ 43.0% - 43.5% ] 43.28% | 75,873 | 8.9% |
[ 43.5% - 44.0% ] 43.83% | 91,519 | 8.2% |
[ 44.0% - 44.5% ] 44.39% | 148,289 | 6.0% |
[ 44.5% - 45.0% ] 44.82% | 482,758 | 8.1% |
[ 45.0% - 45.5% ] 45.22% | 593,597 | 8.7% |
[ 45.5% - 46.0% ] 45.83% | 374,617 | 8.2% |
[ 46.0% - 46.5% ] 46.19% | 463,452 | 6.8% |
[ 46.5% - 47.0% ] 46.77% | 137,110 | 7.3% |
[ 47.0% - 47.5% ] 47.24% | 236,458 | 7.2% |
[ 47.5% - 48.0% ] 47.68% | 204,872 | 8.6% |
[ 48.0% - 48.5% ] 48.33% | 305,963 | 7.8% |
[ 48.5% - 49.0% ] 48.82% | 319,766 | 9.9% |
[ 49.0% - 49.5% ] 49.21% | 730,401 | 9.0% |
[ 49.5% - 50.0% ] 49.72% | 640,756 | 9.0% |
[ 50.0% - 50.5% ] 50.31% | 165,718 | 9.0% |
[ 50.5% - 51.0% ] 50.72% | 847,337 | 8.1% |
[ 51.0% - 51.5% ] 51.26% | 845,868 | 7.9% |
[ 51.5% - 52.0% ] 51.86% | 169,549 | 8.0% |
[ 52.0% - 52.5% ] 52.17% | 277,561 | 10.8% |
[ 52.5% - 53.0% ] 52.70% | 841,320 | 9.4% |
[ 53.0% - 53.5% ] 53.28% | 708,226 | 9.0% |
[ 53.5% - 54.0% ] 53.70% | 775,811 | 9.7% |
[ 54.0% - 54.5% ] 54.25% | 709,891 | 10.5% |
[ 54.5% - 55.0% ] 54.86% | 871,806 | 8.5% |
[ 55.0% - 55.5% ] 55.28% | 858,656 | 10.8% |
[ 55.5% - 56.0% ] 55.80% | 368,443 | 9.4% |
[ 56.0% - 56.5% ] 56.21% | 1,289,775 | 9.1% |
[ 56.5% - 57.0% ] 56.74% | 890,239 | 8.7% |
[ 57.0% - 57.5% ] 57.22% | 815,858 | 9.4% |
[ 57.5% - 58.0% ] 57.72% | 1,498,423 | 9.2% |
[ 58.0% - 58.5% ] 58.27% | 1,525,850 | 9.4% |
[ 58.5% - 59.0% ] 58.89% | 2,638,081 | 8.3% |
[ 59.0% - 59.5% ] 59.24% | 1,733,625 | 8.8% |
[ 59.5% - 60.0% ] 59.75% | 1,249,748 | 8.5% |
[ 60.0% - 60.5% ] 60.31% | 1,208,756 | 8.3% |
[ 60.5% - 61.0% ] 60.77% | 1,153,920 | 10.6% |
[ 61.0% - 61.5% ] 61.19% | 1,611,800 | 8.9% |
[ 61.5% - 62.0% ] 61.77% | 1,934,404 | 9.4% |
[ 62.0% - 62.5% ] 62.24% | 1,537,333 | 9.7% |
[ 62.5% - 63.0% ] 62.74% | 1,596,141 | 9.7% |
[ 63.0% - 63.5% ] 63.23% | 1,321,397 | 9.6% |
[ 63.5% - 64.0% ] 63.68% | 10,447,094 | 9.9% |
[ 64.0% - 64.5% ] 64.09% | 5,381,430 | 9.8% |
[ 64.5% - 65.0% ] 64.74% | 1,586,411 | 9.4% |
[ 65.0% - 65.5% ] 65.26% | 2,390,056 | 10.5% |
[ 65.5% - 66.0% ] 65.77% | 1,748,922 | 9.6% |
[ 66.0% - 66.5% ] 66.26% | 3,249,442 | 10.2% |
[ 66.5% - 67.0% ] 66.73% | 1,734,903 | 9.9% |
[ 67.0% - 67.5% ] 67.25% | 2,369,198 | 9.7% |
[ 67.5% - 68.0% ] 67.79% | 2,889,680 | 9.9% |
[ 68.0% - 68.5% ] 68.25% | 2,832,924 | 10.1% |
[ 68.5% - 69.0% ] 68.69% | 2,414,115 | 10.0% |
[ 69.0% - 69.5% ] 69.26% | 2,240,400 | 9.6% |
[ 69.5% - 70.0% ] 69.73% | 2,698,695 | 10.2% |
[ 70.0% - 70.5% ] 70.24% | 2,779,612 | 10.3% |
[ 70.5% - 71.0% ] 70.73% | 3,120,548 | 10.2% |
[ 71.0% - 71.5% ] 71.14% | 5,113,025 | 10.2% |
[ 71.5% - 72.0% ] 71.76% | 3,348,816 | 9.9% |
[ 72.0% - 72.5% ] 72.27% | 2,977,533 | 10.2% |
[ 72.5% - 73.0% ] 72.73% | 3,317,408 | 11.1% |
[ 73.0% - 73.5% ] 73.24% | 2,755,951 | 10.6% |
[ 73.5% - 74.0% ] 73.76% | 3,199,599 | 9.7% |
[ 74.0% - 74.5% ] 74.31% | 2,918,874 | 10.5% |
[ 74.5% - 75.0% ] 74.75% | 4,179,320 | 10.0% |
[ 75.0% - 75.5% ] 75.25% | 5,521,284 | 10.0% |
[ 75.5% - 76.0% ] 75.72% | 3,617,954 | 10.0% |
[ 76.0% - 76.5% ] 76.24% | 4,198,203 | 10.1% |
[ 76.5% - 77.0% ] 76.76% | 3,756,670 | 10.0% |
[ 77.0% - 77.5% ] 77.27% | 4,303,330 | 11.0% |
[ 77.5% - 78.0% ] 77.77% | 4,427,022 | 10.7% |
[ 78.0% - 78.5% ] 78.23% | 3,710,461 | 9.7% |
[ 78.5% - 79.0% ] 78.77% | 5,560,836 | 10.8% |
[ 79.0% - 79.5% ] 79.23% | 4,832,268 | 11.0% |
[ 79.5% - 80.0% ] 79.73% | 7,119,378 | 10.6% |
[ 80.0% - 80.5% ] 80.27% | 5,466,091 | 10.5% |
[ 80.5% - 81.0% ] 80.74% | 5,946,683 | 11.2% |
[ 81.0% - 81.5% ] 81.22% | 5,663,803 | 11.0% |
[ 81.5% - 82.0% ] 81.75% | 5,996,517 | 10.8% |
[ 82.0% - 82.5% ] 82.30% | 4,131,208 | 11.2% |
[ 82.5% - 83.0% ] 82.75% | 5,953,041 | 10.8% |
[ 83.0% - 83.5% ] 83.26% | 6,101,639 | 11.1% |
[ 83.5% - 84.0% ] 83.77% | 5,019,507 | 10.6% |
[ 84.0% - 84.5% ] 84.23% | 5,915,682 | 10.8% |
[ 84.5% - 85.0% ] 84.77% | 5,444,852 | 11.3% |
[ 85.0% - 85.5% ] 85.27% | 8,587,615 | 12.2% |
[ 85.5% - 86.0% ] 85.76% | 8,828,639 | 12.2% |
[ 86.0% - 86.5% ] 86.20% | 8,314,681 | 11.5% |
[ 86.5% - 87.0% ] 86.75% | 7,148,562 | 11.4% |
[ 87.0% - 87.5% ] 87.25% | 7,969,877 | 11.8% |
[ 87.5% - 88.0% ] 87.78% | 7,699,300 | 11.8% |
[ 88.0% - 88.5% ] 88.24% | 9,939,543 | 12.0% |
[ 88.5% - 89.0% ] 88.76% | 8,916,321 | 11.9% |
[ 89.0% - 89.5% ] 89.26% | 10,265,231 | 12.2% |
[ 89.5% - 90.0% ] 89.74% | 11,706,797 | 12.4% |
[ 90.0% - 90.5% ] 90.24% | 9,900,995 | 12.0% |
[ 90.5% - 91.0% ] 90.75% | 10,799,289 | 12.4% |
[ 91.0% - 91.5% ] 91.26% | 12,116,800 | 12.5% |
[ 91.5% - 92.0% ] 91.77% | 11,980,544 | 13.1% |
[ 92.0% - 92.5% ] 92.26% | 11,626,016 | 13.2% |
[ 92.5% - 93.0% ] 92.76% | 12,649,207 | 12.9% |
[ 93.0% - 93.5% ] 93.25% | 13,109,691 | 13.3% |
[ 93.5% - 94.0% ] 93.76% | 13,732,186 | 13.2% |
[ 94.0% - 94.5% ] 94.25% | 14,493,457 | 14.2% |
[ 94.5% - 95.0% ] 94.74% | 13,513,034 | 13.5% |
[ 95.0% - 95.5% ] 95.25% | 13,922,057 | 13.9% |
[ 95.5% - 96.0% ] 95.75% | 14,674,464 | 14.2% |
[ 96.0% - 96.5% ] 96.25% | 14,908,398 | 14.9% |
[ 96.5% - 97.0% ] 96.76% | 15,740,454 | 15.2% |
[ 97.0% - 97.5% ] 97.26% | 15,837,610 | 15.5% |
[ 97.5% - 98.0% ] 97.76% | 16,662,441 | 15.7% |
[ 98.0% - 98.5% ] 98.25% | 15,750,949 | 16.2% |
[ 98.5% - 99.0% ] 98.75% | 15,913,690 | 17.3% |
[ 99.0% - 99.5% ] 99.24% | 14,924,876 | 17.4% |
[ 99.5% - 100.0% ] 99.84% | 17,059,534 | 19.2% |