Immigrants from Latvia Wage/Income Gap

COMPARE

Immigrants from Latvia
Race
Ancestry
AfghanAfricanAlaska NativeAlaskan AthabascanAlbanianAleutAlsatianAmericanApacheArabArapahoArgentineanArmenianAssyrian/Chaldean/SyriacAustralianAustrianBahamianBangladeshiBarbadianBasqueBelgianBelizeanBermudanBhutaneseBlackfeetBolivianBrazilianBritishBritish West IndianBulgarianBurmeseCajunCambodianCanadianCape VerdeanCarpatho RusynCelticCentral AmericanCentral American IndianCherokeeCheyenneChickasawChileanChineseChippewaChoctawColombianColvilleComancheCosta RicanCreeCreekCroatianCrowCubanCypriotCzechCzechoslovakianDanishDelawareDominicanDutchDutch West IndianEastern EuropeanEcuadorianEgyptianEnglishEstonianEthiopianEuropeanFijianFilipinoFinnishFrenchFrench American IndianFrench CanadianGermanGerman RussianGhanaianGreekGuamanian/ChamorroGuatemalanGuyaneseHaitianHmongHonduranHopiHoumaHungarianIcelanderIndian (Asian)IndonesianInupiatIranianIraqiIrishIroquoisIsraeliItalianJamaicanJapaneseJordanianKenyanKiowaKoreanLaotianLatvianLebaneseLiberianLithuanianLumbeeLuxembourgerMacedonianMalaysianMalteseMarshalleseMenomineeMexicanMexican American IndianMongolianMoroccanNative HawaiianNavajoNepaleseNew ZealanderNicaraguanNigerianNorthern EuropeanNorwegianOkinawanOsageOttawaPaiutePakistaniPalestinianPanamanianParaguayanPennsylvania GermanPeruvianPimaPolishPortuguesePotawatomiPuebloPuerto RicanPuget Sound SalishRomanianRussianSalvadoranSamoanScandinavianScotch-IrishScottishSeminoleSenegaleseSerbianShoshoneSierra LeoneanSiouxSlavicSlovakSloveneSomaliSouth AfricanSouth AmericanSouth American IndianSoviet UnionSpaniardSpanishSpanish AmericanSpanish American IndianSri LankanSubsaharan AfricanSudaneseSwedishSwissSyrianTaiwaneseThaiTlingit-HaidaTohono O'OdhamTonganTrinidadian and TobagonianTsimshianTurkishU.S. Virgin IslanderUgandanUkrainianUruguayanUteVenezuelanVietnameseWelshWest IndianYakamaYaquiYugoslavianYumanYup'ikZimbabwean
Immigration
NonimmigrantsImmigrantsAfghanistanAfricaAlbaniaArgentinaArmeniaAsiaAustraliaAustriaBahamasBangladeshBarbadosBelarusBelgiumBelizeBoliviaBosnia and HerzegovinaBrazilBulgariaBurma/MyanmarCabo VerdeCambodiaCameroonCanadaCaribbeanCentral AmericaChileChinaColombiaCongoCosta RicaCroatiaCubaCzechoslovakiaDenmarkDominicaDominican RepublicEastern AfricaEastern AsiaEastern EuropeEcuadorEgyptEl SalvadorEnglandEritreaEthiopiaEuropeFijiFranceGermanyGhanaGreeceGrenadaGuatemalaGuyanaHaitiHondurasHong KongHungaryIndiaIndonesiaIranIraqIrelandIsraelItalyJamaicaJapanJordanKazakhstanKenyaKoreaKuwaitLaosLatin AmericaLatviaLebanonLiberiaLithuaniaMalaysiaMexicoMicronesiaMiddle AfricaMoldovaMoroccoNepalNetherlandsNicaraguaNigeriaNorth AmericaNorth MacedoniaNorthern AfricaNorthern EuropeNorwayOceaniaPakistanPanamaPeruPhilippinesPolandPortugalRomaniaRussiaSaudi ArabiaScotlandSenegalSerbiaSierra LeoneSingaporeSomaliaSouth AfricaSouth AmericaSouth Central AsiaSouth Eastern AsiaSouthern EuropeSpainSri LankaSt. Vincent and the GrenadinesSudanSwedenSwitzerlandSyriaTaiwanThailandTrinidad and TobagoTurkeyUgandaUkraineUruguayUzbekistanVenezuelaVietnamWest IndiesWestern AfricaWestern AsiaWestern EuropeYemenZaireZimbabweAzores
Select to Compare
Race
Ancestry
AfghanAfricanAlaska NativeAlaskan AthabascanAlbanianAleutAlsatianAmericanApacheArabArapahoArgentineanArmenianAssyrian/Chaldean/SyriacAustralianAustrianBahamianBangladeshiBarbadianBasqueBelgianBelizeanBermudanBhutaneseBlackfeetBolivianBrazilianBritishBritish West IndianBulgarianBurmeseCajunCambodianCanadianCape VerdeanCarpatho RusynCelticCentral AmericanCentral American IndianCherokeeCheyenneChickasawChileanChineseChippewaChoctawColombianColvilleComancheCosta RicanCreeCreekCroatianCrowCubanCypriotCzechCzechoslovakianDanishDelawareDominicanDutchDutch West IndianEastern EuropeanEcuadorianEgyptianEnglishEstonianEthiopianEuropeanFijianFilipinoFinnishFrenchFrench American IndianFrench CanadianGermanGerman RussianGhanaianGreekGuamanian/ChamorroGuatemalanGuyaneseHaitianHmongHonduranHopiHoumaHungarianIcelanderIndian (Asian)IndonesianInupiatIranianIraqiIrishIroquoisIsraeliItalianJamaicanJapaneseJordanianKenyanKiowaKoreanLaotianLatvianLebaneseLiberianLithuanianLumbeeLuxembourgerMacedonianMalaysianMalteseMarshalleseMenomineeMexicanMexican American IndianMongolianMoroccanNative HawaiianNavajoNepaleseNew ZealanderNicaraguanNigerianNorthern EuropeanNorwegianOkinawanOsageOttawaPaiutePakistaniPalestinianPanamanianParaguayanPennsylvania GermanPeruvianPimaPolishPortuguesePotawatomiPuebloPuerto RicanPuget Sound SalishRomanianRussianSalvadoranSamoanScandinavianScotch-IrishScottishSeminoleSenegaleseSerbianShoshoneSierra LeoneanSiouxSlavicSlovakSloveneSomaliSouth AfricanSouth AmericanSouth American IndianSoviet UnionSpaniardSpanishSpanish AmericanSpanish American IndianSri LankanSubsaharan AfricanSudaneseSwedishSwissSyrianTaiwaneseThaiTlingit-HaidaTohono O'OdhamTonganTrinidadian and TobagonianTsimshianTurkishU.S. Virgin IslanderUgandanUkrainianUruguayanUteVenezuelanVietnameseWelshWest IndianYakamaYaquiYugoslavianYumanYup'ikZimbabwean
Immigration
NonimmigrantsImmigrantsAfghanistanAfricaAlbaniaArgentinaArmeniaAsiaAustraliaAustriaBahamasBangladeshBarbadosBelarusBelgiumBelizeBoliviaBosnia and HerzegovinaBrazilBulgariaBurma/MyanmarCabo VerdeCambodiaCameroonCanadaCaribbeanCentral AmericaChileChinaColombiaCongoCosta RicaCroatiaCubaCzechoslovakiaDenmarkDominicaDominican RepublicEastern AfricaEastern AsiaEastern EuropeEcuadorEgyptEl SalvadorEnglandEritreaEthiopiaEuropeFijiFranceGermanyGhanaGreeceGrenadaGuatemalaGuyanaHaitiHondurasHong KongHungaryIndiaIndonesiaIranIraqIrelandIsraelItalyJamaicaJapanJordanKazakhstanKenyaKoreaKuwaitLaosLatin AmericaLebanonLiberiaLithuaniaMalaysiaMexicoMicronesiaMiddle AfricaMoldovaMoroccoNepalNetherlandsNicaraguaNigeriaNorth AmericaNorth MacedoniaNorthern AfricaNorthern EuropeNorwayOceaniaPakistanPanamaPeruPhilippinesPolandPortugalRomaniaRussiaSaudi ArabiaScotlandSenegalSerbiaSierra LeoneSingaporeSomaliaSouth AfricaSouth AmericaSouth Central AsiaSouth Eastern AsiaSouthern EuropeSpainSri LankaSt. Vincent and the GrenadinesSudanSwedenSwitzerlandSyriaTaiwanThailandTrinidad and TobagoTurkeyUgandaUkraineUruguayUzbekistanVenezuelaVietnamWest IndiesWestern AfricaWestern AsiaWestern EuropeYemenZaireZimbabweAzores
Wage/Income Gap
Income
Poverty
Unemployment
Labor Participation
Family Structure
Vehicle Availability
Education Level
Disability

Immigrants from Latvia Wage/Income Gap
Tragic

26.7%
WAGE/INCOME GAP
8.9/ 100
METRIC RATING
220th/ 347
METRIC RANK

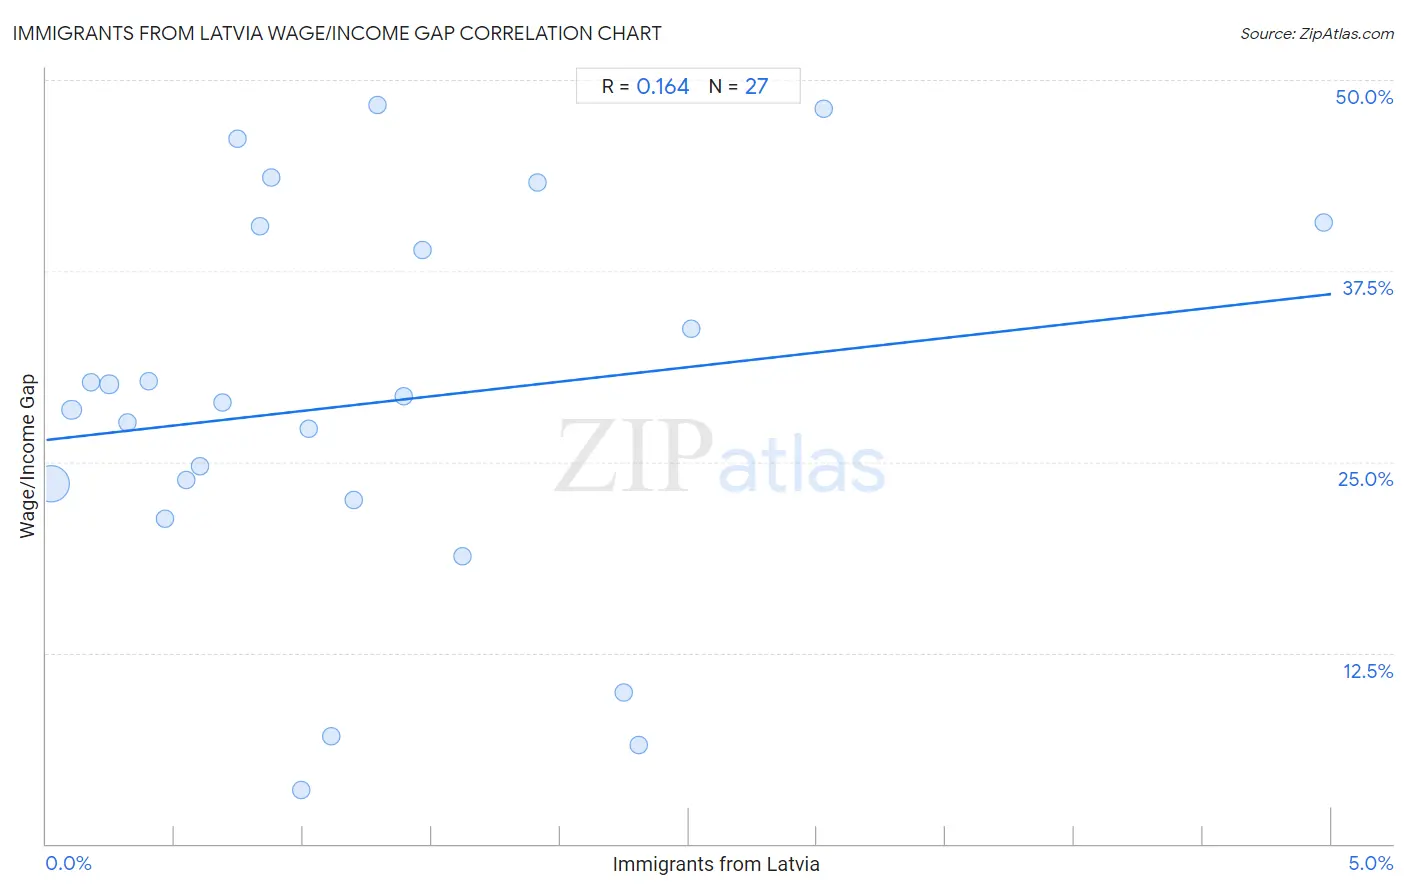
Immigrants from Latvia Wage/Income Gap Correlation Chart

The statistical analysis conducted on geographies consisting of 113,720,883 people shows a poor positive correlation between the proportion of Immigrants from Latvia and wage/income gap percentage in the United States with a correlation coefficient (R) of 0.164 and weighted average of 26.7%. On average, for every 1% (one percent) increase in Immigrants from Latvia within a typical geography, there is an increase of 1.9% in wage/income gap percentage.
Immigrants from Latvia Wage/Income Gap
It is essential to understand that the correlation between the percentage of Immigrants from Latvia and wage/income gap percentage does not imply a direct cause-and-effect relationship. It remains uncertain whether the presence of Immigrants from Latvia influences an upward or downward trend in the level of wage/income gap percentage within an area, or if Immigrants from Latvia simply ended up residing in those areas with higher or lower levels of wage/income gap percentage due to other factors.

Demographics Similar to Immigrants from Latvia by Wage/Income Gap

In terms of wage/income gap, the demographic groups most similar to Immigrants from Latvia are Immigrants from Poland (26.7%, a difference of 0.010%), Immigrants from Saudi Arabia (26.7%, a difference of 0.040%), Brazilian (26.7%, a difference of 0.070%), Immigrants from Spain (26.8%, a difference of 0.070%), and Bolivian (26.8%, a difference of 0.11%).
DemographicsRating | RankWage/Income Gap
Immigrants from Iraq
10.3
/100
|
#213
Poor
26.7%
Immigrants from China
10.3
/100
|
#214
Poor
26.7%
Yugoslavians
9.7
/100
|
#215
Tragic
26.7%
Immigrants from Portugal
9.5
/100
|
#216
Tragic
26.7%
Brazilians
9.2
/100
|
#217
Tragic
26.7%
Immigrants from Saudi Arabia
9.1
/100
|
#218
Tragic
26.7%
Immigrants from Poland
8.9
/100
|
#219
Tragic
26.7%
Immigrants from Latvia
8.9
/100
|
#220
Tragic
26.7%
Immigrants from Spain
8.5
/100
|
#221
Tragic
26.8%
Bolivians
8.3
/100
|
#222
Tragic
26.8%
Jordanians
8.0
/100
|
#223
Tragic
26.8%
Immigrants from Argentina
7.2
/100
|
#224
Tragic
26.8%
Immigrants from Ireland
6.5
/100
|
#225
Tragic
26.9%
Asians
5.9
/100
|
#226
Tragic
26.9%
Spaniards
5.6
/100
|
#227
Tragic
27.0%

Immigrants from Latvia Wage/Income Gap Correlation Summary

MeasurementImmigrants from Latvia DataWage/Income Gap Data
Minimum0.020%3.5%
Maximum5.0%48.4%
Range5.0%44.8%
Mean1.2%28.8%
Median0.99%28.9%
Interquartile 25% (IQ1)0.46%22.5%
Interquartile 75% (IQ3)1.6%40.4%
Interquartile Range (IQR)1.2%18.0%
Standard Deviation (Sample)1.1%12.6%
Standard Deviation (Population)1.1%12.4%

Correlation Details

Immigrants from Latvia PercentileSample SizeWage/Income Gap
[
0.0%
-
0.5%
]
0.020%
100,030,25723.5%
[
0.0%
-
0.5%
]
0.100%
8,834,33928.4%
[
0.0%
-
0.5%
]
0.17%
2,277,74930.2%
[
0.0%
-
0.5%
]
0.25%
1,192,21630.1%
[
0.0%
-
0.5%
]
0.32%
586,37527.6%
[
0.0%
-
0.5%
]
0.40%
334,73430.3%
[
0.0%
-
0.5%
]
0.46%
146,72221.3%
[
0.5%
-
1.0%
]
0.55%
61,20423.8%
[
0.5%
-
1.0%
]
0.60%
26,74024.7%
[
0.5%
-
1.0%
]
0.69%
66,08128.9%
[
0.5%
-
1.0%
]
0.74%
14,77346.2%
[
0.5%
-
1.0%
]
0.83%
11,05440.4%
[
0.5%
-
1.0%
]
0.87%
72,92943.6%
[
0.5%
-
1.0%
]
0.99%
4,5283.5%
[
1.0%
-
1.5%
]
1.02%
7,14927.1%
[
1.0%
-
1.5%
]
1.11%
5,4047.0%
[
1.0%
-
1.5%
]
1.20%
91922.5%
[
1.0%
-
1.5%
]
1.29%
1,24048.4%
[
1.0%
-
1.5%
]
1.39%
4,02829.3%
[
1.0%
-
1.5%
]
1.46%
12,78938.8%
[
1.5%
-
2.0%
]
1.62%
2,03618.8%
[
1.5%
-
2.0%
]
1.91%
7,89743.3%
[
2.0%
-
2.5%
]
2.25%
6,1899.9%
[
2.0%
-
2.5%
]
2.30%
5646.4%
[
2.5%
-
3.0%
]
2.51%
27933.7%
[
3.0%
-
3.5%
]
3.03%
8,42548.1%
[
4.5%
-
5.0%
]
4.97%
4,26340.7%