Immigrants from Latvia 4 or more Vehicles in Household

COMPARE

Immigrants from Latvia
Race
Ancestry
AfghanAfricanAlaska NativeAlaskan AthabascanAlbanianAleutAlsatianAmericanApacheArabArapahoArgentineanArmenianAssyrian/Chaldean/SyriacAustralianAustrianBahamianBangladeshiBarbadianBasqueBelgianBelizeanBermudanBhutaneseBlackfeetBolivianBrazilianBritishBritish West IndianBulgarianBurmeseCajunCambodianCanadianCape VerdeanCarpatho RusynCelticCentral AmericanCentral American IndianCherokeeCheyenneChickasawChileanChineseChippewaChoctawColombianColvilleComancheCosta RicanCreeCreekCroatianCrowCubanCypriotCzechCzechoslovakianDanishDelawareDominicanDutchDutch West IndianEastern EuropeanEcuadorianEgyptianEnglishEstonianEthiopianEuropeanFijianFilipinoFinnishFrenchFrench American IndianFrench CanadianGermanGerman RussianGhanaianGreekGuamanian/ChamorroGuatemalanGuyaneseHaitianHmongHonduranHopiHoumaHungarianIcelanderIndian (Asian)IndonesianInupiatIranianIraqiIrishIroquoisIsraeliItalianJamaicanJapaneseJordanianKenyanKiowaKoreanLaotianLatvianLebaneseLiberianLithuanianLumbeeLuxembourgerMacedonianMalaysianMalteseMarshalleseMenomineeMexicanMexican American IndianMongolianMoroccanNative HawaiianNavajoNepaleseNew ZealanderNicaraguanNigerianNorthern EuropeanNorwegianOkinawanOsageOttawaPaiutePakistaniPalestinianPanamanianParaguayanPennsylvania GermanPeruvianPimaPolishPortuguesePotawatomiPuebloPuerto RicanPuget Sound SalishRomanianRussianSalvadoranSamoanScandinavianScotch-IrishScottishSeminoleSenegaleseSerbianShoshoneSierra LeoneanSiouxSlavicSlovakSloveneSomaliSouth AfricanSouth AmericanSouth American IndianSoviet UnionSpaniardSpanishSpanish AmericanSpanish American IndianSri LankanSubsaharan AfricanSudaneseSwedishSwissSyrianTaiwaneseThaiTlingit-HaidaTohono O'OdhamTonganTrinidadian and TobagonianTsimshianTurkishU.S. Virgin IslanderUgandanUkrainianUruguayanUteVenezuelanVietnameseWelshWest IndianYakamaYaquiYugoslavianYumanYup'ikZimbabwean
Immigration
NonimmigrantsImmigrantsAfghanistanAfricaAlbaniaArgentinaArmeniaAsiaAustraliaAustriaBahamasBangladeshBarbadosBelarusBelgiumBelizeBoliviaBosnia and HerzegovinaBrazilBulgariaBurma/MyanmarCabo VerdeCambodiaCameroonCanadaCaribbeanCentral AmericaChileChinaColombiaCongoCosta RicaCroatiaCubaCzechoslovakiaDenmarkDominicaDominican RepublicEastern AfricaEastern AsiaEastern EuropeEcuadorEgyptEl SalvadorEnglandEritreaEthiopiaEuropeFijiFranceGermanyGhanaGreeceGrenadaGuatemalaGuyanaHaitiHondurasHong KongHungaryIndiaIndonesiaIranIraqIrelandIsraelItalyJamaicaJapanJordanKazakhstanKenyaKoreaKuwaitLaosLatin AmericaLatviaLebanonLiberiaLithuaniaMalaysiaMexicoMicronesiaMiddle AfricaMoldovaMoroccoNepalNetherlandsNicaraguaNigeriaNorth AmericaNorth MacedoniaNorthern AfricaNorthern EuropeNorwayOceaniaPakistanPanamaPeruPhilippinesPolandPortugalRomaniaRussiaSaudi ArabiaScotlandSenegalSerbiaSierra LeoneSingaporeSomaliaSouth AfricaSouth AmericaSouth Central AsiaSouth Eastern AsiaSouthern EuropeSpainSri LankaSt. Vincent and the GrenadinesSudanSwedenSwitzerlandSyriaTaiwanThailandTrinidad and TobagoTurkeyUgandaUkraineUruguayUzbekistanVenezuelaVietnamWest IndiesWestern AfricaWestern AsiaWestern EuropeYemenZaireZimbabweAzores
Select to Compare
Race
Ancestry
AfghanAfricanAlaska NativeAlaskan AthabascanAlbanianAleutAlsatianAmericanApacheArabArapahoArgentineanArmenianAssyrian/Chaldean/SyriacAustralianAustrianBahamianBangladeshiBarbadianBasqueBelgianBelizeanBermudanBhutaneseBlackfeetBolivianBrazilianBritishBritish West IndianBulgarianBurmeseCajunCambodianCanadianCape VerdeanCarpatho RusynCelticCentral AmericanCentral American IndianCherokeeCheyenneChickasawChileanChineseChippewaChoctawColombianColvilleComancheCosta RicanCreeCreekCroatianCrowCubanCypriotCzechCzechoslovakianDanishDelawareDominicanDutchDutch West IndianEastern EuropeanEcuadorianEgyptianEnglishEstonianEthiopianEuropeanFijianFilipinoFinnishFrenchFrench American IndianFrench CanadianGermanGerman RussianGhanaianGreekGuamanian/ChamorroGuatemalanGuyaneseHaitianHmongHonduranHopiHoumaHungarianIcelanderIndian (Asian)IndonesianInupiatIranianIraqiIrishIroquoisIsraeliItalianJamaicanJapaneseJordanianKenyanKiowaKoreanLaotianLatvianLebaneseLiberianLithuanianLumbeeLuxembourgerMacedonianMalaysianMalteseMarshalleseMenomineeMexicanMexican American IndianMongolianMoroccanNative HawaiianNavajoNepaleseNew ZealanderNicaraguanNigerianNorthern EuropeanNorwegianOkinawanOsageOttawaPaiutePakistaniPalestinianPanamanianParaguayanPennsylvania GermanPeruvianPimaPolishPortuguesePotawatomiPuebloPuerto RicanPuget Sound SalishRomanianRussianSalvadoranSamoanScandinavianScotch-IrishScottishSeminoleSenegaleseSerbianShoshoneSierra LeoneanSiouxSlavicSlovakSloveneSomaliSouth AfricanSouth AmericanSouth American IndianSoviet UnionSpaniardSpanishSpanish AmericanSpanish American IndianSri LankanSubsaharan AfricanSudaneseSwedishSwissSyrianTaiwaneseThaiTlingit-HaidaTohono O'OdhamTonganTrinidadian and TobagonianTsimshianTurkishU.S. Virgin IslanderUgandanUkrainianUruguayanUteVenezuelanVietnameseWelshWest IndianYakamaYaquiYugoslavianYumanYup'ikZimbabwean
Immigration
NonimmigrantsImmigrantsAfghanistanAfricaAlbaniaArgentinaArmeniaAsiaAustraliaAustriaBahamasBangladeshBarbadosBelarusBelgiumBelizeBoliviaBosnia and HerzegovinaBrazilBulgariaBurma/MyanmarCabo VerdeCambodiaCameroonCanadaCaribbeanCentral AmericaChileChinaColombiaCongoCosta RicaCroatiaCubaCzechoslovakiaDenmarkDominicaDominican RepublicEastern AfricaEastern AsiaEastern EuropeEcuadorEgyptEl SalvadorEnglandEritreaEthiopiaEuropeFijiFranceGermanyGhanaGreeceGrenadaGuatemalaGuyanaHaitiHondurasHong KongHungaryIndiaIndonesiaIranIraqIrelandIsraelItalyJamaicaJapanJordanKazakhstanKenyaKoreaKuwaitLaosLatin AmericaLebanonLiberiaLithuaniaMalaysiaMexicoMicronesiaMiddle AfricaMoldovaMoroccoNepalNetherlandsNicaraguaNigeriaNorth AmericaNorth MacedoniaNorthern AfricaNorthern EuropeNorwayOceaniaPakistanPanamaPeruPhilippinesPolandPortugalRomaniaRussiaSaudi ArabiaScotlandSenegalSerbiaSierra LeoneSingaporeSomaliaSouth AfricaSouth AmericaSouth Central AsiaSouth Eastern AsiaSouthern EuropeSpainSri LankaSt. Vincent and the GrenadinesSudanSwedenSwitzerlandSyriaTaiwanThailandTrinidad and TobagoTurkeyUgandaUkraineUruguayUzbekistanVenezuelaVietnamWest IndiesWestern AfricaWestern AsiaWestern EuropeYemenZaireZimbabweAzores
4 or more Vehicles in Household
Income
Poverty
Unemployment
Labor Participation
Family Structure
Vehicle Availability
Education Level
Disability

Immigrants from Latvia 4 or more Vehicles in Household
Tragic

5.5%
4+ VEHICLES AVAILABLE
0.5/ 100
METRIC RATING
276th/ 347
METRIC RANK

Immigrants from Latvia 4 or more Vehicles in Household Correlation Chart

The statistical analysis conducted on geographies consisting of 113,394,879 people shows a poor positive correlation between the proportion of Immigrants from Latvia and percentage of households with 4 or more vehicles available in the United States with a correlation coefficient (R) of 0.162 and weighted average of 5.5%. On average, for every 1% (one percent) increase in Immigrants from Latvia within a typical geography, there is an increase of 0.30% in percentage of households with 4 or more vehicles available.
Immigrants from Latvia 4 or more Vehicles in Household
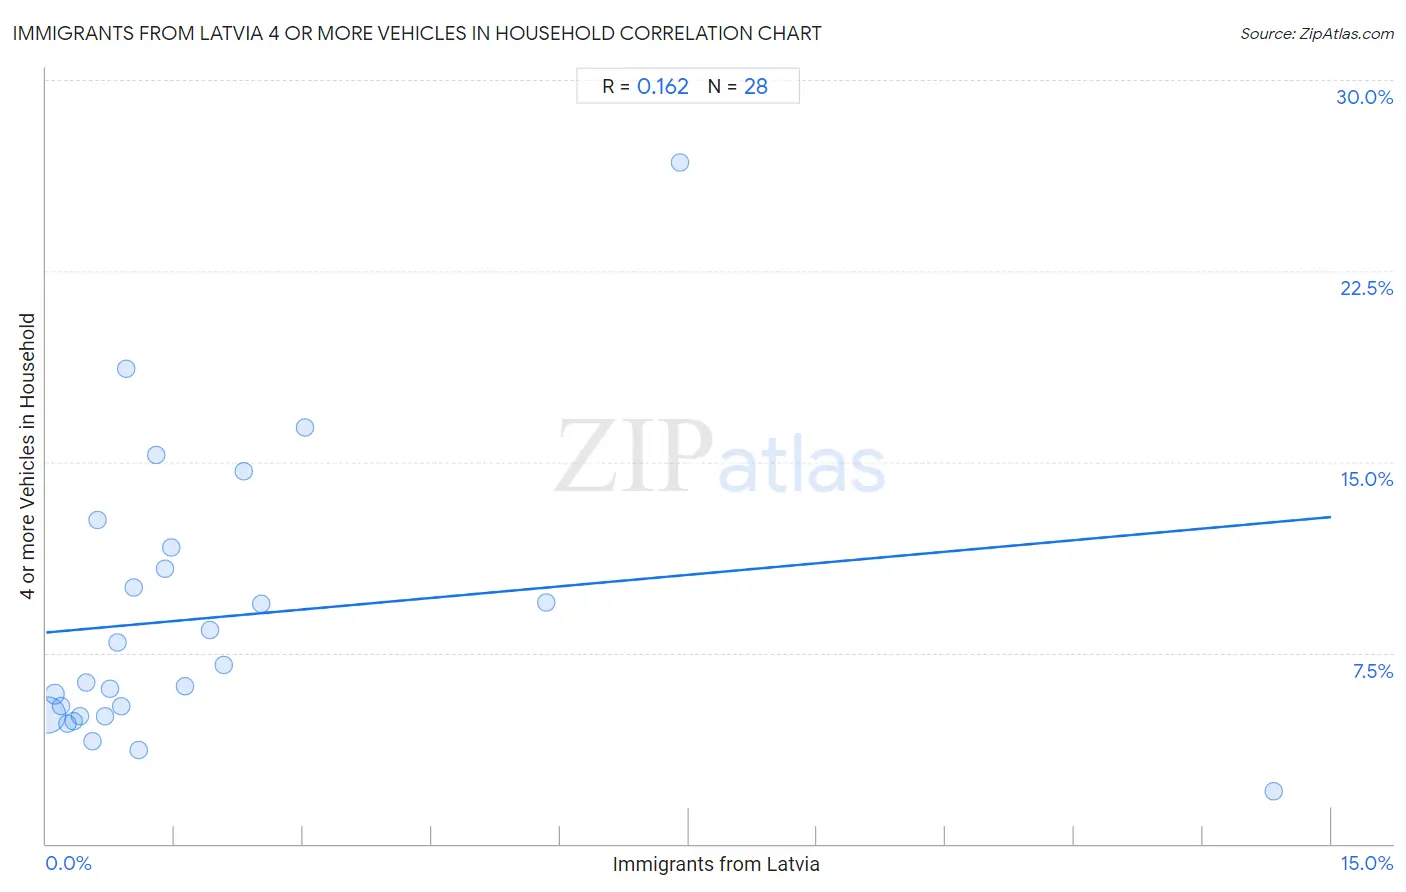
It is essential to understand that the correlation between the percentage of Immigrants from Latvia and percentage of households with 4 or more vehicles available does not imply a direct cause-and-effect relationship. It remains uncertain whether the presence of Immigrants from Latvia influences an upward or downward trend in the level of percentage of households with 4 or more vehicles available within an area, or if Immigrants from Latvia simply ended up residing in those areas with higher or lower levels of percentage of households with 4 or more vehicles available due to other factors.

Demographics Similar to Immigrants from Latvia by 4 or more Vehicles in Household

In terms of 4 or more vehicles in household, the demographic groups most similar to Immigrants from Latvia are Cambodian (5.5%, a difference of 0.010%), Immigrants from Bulgaria (5.5%, a difference of 0.12%), Black/African American (5.5%, a difference of 0.13%), Macedonian (5.5%, a difference of 0.25%), and Immigrants from Kazakhstan (5.5%, a difference of 0.28%).
DemographicsRating | Rank4 or more Vehicles in Household
Carpatho Rusyns
0.7
/100
|
#269
Tragic
5.5%
Okinawans
0.6
/100
|
#270
Tragic
5.5%
Immigrants from Sudan
0.6
/100
|
#271
Tragic
5.5%
Immigrants from Kazakhstan
0.6
/100
|
#272
Tragic
5.5%
Macedonians
0.6
/100
|
#273
Tragic
5.5%
Blacks/African Americans
0.6
/100
|
#274
Tragic
5.5%
Cambodians
0.5
/100
|
#275
Tragic
5.5%
Immigrants from Latvia
0.5
/100
|
#276
Tragic
5.5%
Immigrants from Bulgaria
0.5
/100
|
#277
Tragic
5.5%
Immigrants from Eastern Europe
0.4
/100
|
#278
Tragic
5.4%
Immigrants from Uruguay
0.3
/100
|
#279
Tragic
5.4%
Alsatians
0.3
/100
|
#280
Tragic
5.4%
Immigrants from Western Africa
0.3
/100
|
#281
Tragic
5.4%
Immigrants from Spain
0.3
/100
|
#282
Tragic
5.4%
Immigrants from Ireland
0.3
/100
|
#283
Tragic
5.4%

Immigrants from Latvia 4 or more Vehicles in Household Correlation Summary

MeasurementImmigrants from Latvia Data4 or more Vehicles in Household Data
Minimum0.020%2.0%
Maximum14.3%26.8%
Range14.3%24.7%
Mean1.9%8.9%
Median0.98%6.7%
Interquartile 25% (IQ1)0.50%5.0%
Interquartile 75% (IQ3)2.0%11.2%
Interquartile Range (IQR)1.5%6.2%
Standard Deviation (Sample)2.9%5.5%
Standard Deviation (Population)2.9%5.4%

Correlation Details

Immigrants from Latvia PercentileSample Size4 or more Vehicles in Household
[
0.0%
-
0.5%
]
0.020%
99,797,8995.1%
[
0.0%
-
0.5%
]
0.100%
8,791,7445.9%
[
0.0%
-
0.5%
]
0.17%
2,236,1905.4%
[
0.0%
-
0.5%
]
0.25%
1,192,6724.7%
[
0.0%
-
0.5%
]
0.32%
583,6634.8%
[
0.0%
-
0.5%
]
0.40%
336,9865.0%
[
0.0%
-
0.5%
]
0.46%
147,3366.3%
[
0.5%
-
1.0%
]
0.54%
65,4264.0%
[
0.5%
-
1.0%
]
0.60%
26,74012.7%
[
0.5%
-
1.0%
]
0.69%
66,5005.0%
[
0.5%
-
1.0%
]
0.74%
14,7736.1%
[
0.5%
-
1.0%
]
0.83%
11,0547.9%
[
0.5%
-
1.0%
]
0.87%
72,9295.4%
[
0.5%
-
1.0%
]
0.94%
21318.7%
[
1.0%
-
1.5%
]
1.02%
7,14910.1%
[
1.0%
-
1.5%
]
1.08%
8303.7%
[
1.0%
-
1.5%
]
1.29%
1,24015.3%
[
1.0%
-
1.5%
]
1.39%
4,24810.8%
[
1.0%
-
1.5%
]
1.46%
12,78911.6%
[
1.5%
-
2.0%
]
1.62%
2,0366.2%
[
1.5%
-
2.0%
]
1.91%
7,8978.4%
[
2.0%
-
2.5%
]
2.08%
7717.0%
[
2.0%
-
2.5%
]
2.30%
56414.6%
[
2.5%
-
3.0%
]
2.51%
2799.4%
[
3.0%
-
3.5%
]
3.03%
8,42516.4%
[
5.5%
-
6.0%
]
5.83%
2239.5%
[
7.0%
-
7.5%
]
7.39%
2,31326.8%
[
14.0%
-
14.5%
]
14.32%
1,9902.0%