Immigrants from Jamaica Wage/Income Gap
COMPARE
Immigrants from Jamaica
Select to Compare
Wage/Income Gap
Immigrants from Jamaica Wage/Income Gap
18.8%
WAGE/INCOME GAP
100.0/ 100
METRIC RATING
8th/ 347
METRIC RANK
Immigrants from Jamaica Wage/Income Gap Correlation Chart
The statistical analysis conducted on geographies consisting of 301,660,562 people shows a moderate negative correlation between the proportion of Immigrants from Jamaica and wage/income gap percentage in the United States with a correlation coefficient (R) of -0.444 and weighted average of 18.8%. On average, for every 1% (one percent) increase in Immigrants from Jamaica within a typical geography, there is a decrease of 0.56% in wage/income gap percentage.
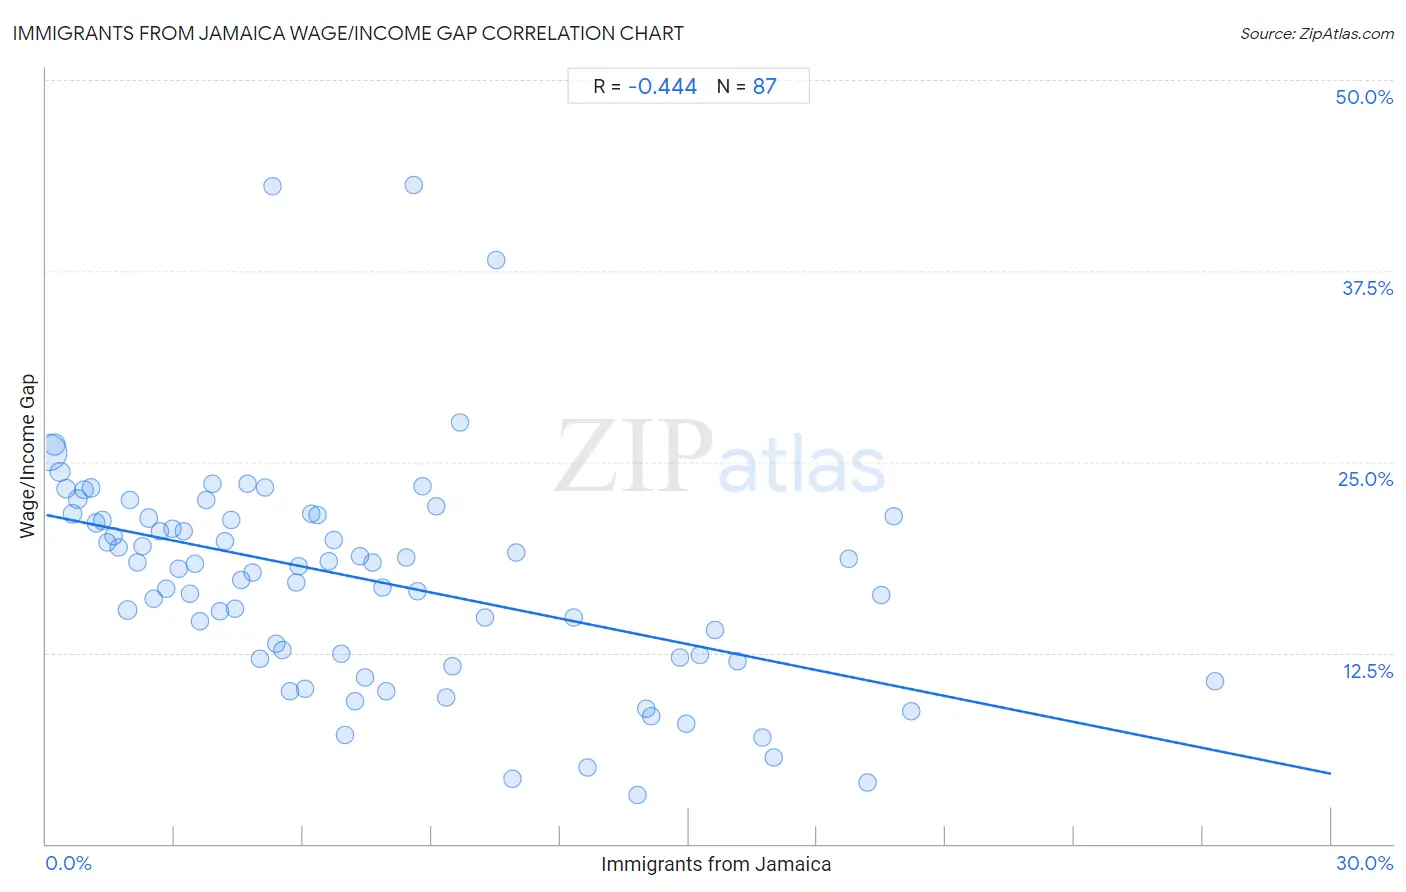
It is essential to understand that the correlation between the percentage of Immigrants from Jamaica and wage/income gap percentage does not imply a direct cause-and-effect relationship. It remains uncertain whether the presence of Immigrants from Jamaica influences an upward or downward trend in the level of wage/income gap percentage within an area, or if Immigrants from Jamaica simply ended up residing in those areas with higher or lower levels of wage/income gap percentage due to other factors.
Demographics Similar to Immigrants from Jamaica by Wage/Income Gap
In terms of wage/income gap, the demographic groups most similar to Immigrants from Jamaica are Puerto Rican (18.7%, a difference of 0.63%), Barbadian (19.0%, a difference of 0.66%), Crow (19.1%, a difference of 1.2%), Immigrants from Haiti (19.2%, a difference of 2.0%), and Immigrants from West Indies (19.2%, a difference of 2.1%).
| Demographics | Rating | Rank | Wage/Income Gap |
| Immigrants from Grenada | 100.0 /100 | #1 | Exceptional 16.2% |
| Immigrants from St. Vincent and the Grenadines | 100.0 /100 | #2 | Exceptional 16.4% |
| Immigrants from Barbados | 100.0 /100 | #3 | Exceptional 17.8% |
| British West Indians | 100.0 /100 | #4 | Exceptional 18.0% |
| Guyanese | 100.0 /100 | #5 | Exceptional 18.3% |
| Immigrants from Guyana | 100.0 /100 | #6 | Exceptional 18.4% |
| Puerto Ricans | 100.0 /100 | #7 | Exceptional 18.7% |
| Immigrants from Jamaica | 100.0 /100 | #8 | Exceptional 18.8% |
| Barbadians | 100.0 /100 | #9 | Exceptional 19.0% |
| Crow | 100.0 /100 | #10 | Exceptional 19.1% |
| Immigrants from Haiti | 100.0 /100 | #11 | Exceptional 19.2% |
| Immigrants from West Indies | 100.0 /100 | #12 | Exceptional 19.2% |
| Trinidadians and Tobagonians | 100.0 /100 | #13 | Exceptional 19.3% |
| Immigrants from Trinidad and Tobago | 100.0 /100 | #14 | Exceptional 19.3% |
| West Indians | 100.0 /100 | #15 | Exceptional 19.6% |
Immigrants from Jamaica Wage/Income Gap Correlation Summary
| Measurement | Immigrants from Jamaica Data | Wage/Income Gap Data |
| Minimum | 0.055% | 3.2% |
| Maximum | 27.3% | 43.2% |
| Range | 27.2% | 40.0% |
| Mean | 7.4% | 17.4% |
| Median | 5.9% | 18.2% |
| Interquartile 25% (IQ1) | 3.0% | 12.2% |
| Interquartile 75% (IQ3) | 10.2% | 21.4% |
| Interquartile Range (IQR) | 7.3% | 9.2% |
| Standard Deviation (Sample) | 5.8% | 7.3% |
| Standard Deviation (Population) | 5.7% | 7.3% |
Correlation Details
| Immigrants from Jamaica Percentile | Sample Size | Wage/Income Gap |
[ 0.0% - 0.5% ] 0.055% | 167,389,177 | 25.6% |
[ 0.0% - 0.5% ] 0.19% | 41,875,031 | 26.1% |
[ 0.0% - 0.5% ] 0.33% | 20,479,975 | 24.3% |
[ 0.0% - 0.5% ] 0.47% | 12,805,524 | 23.2% |
[ 0.5% - 1.0% ] 0.61% | 10,844,727 | 21.6% |
[ 0.5% - 1.0% ] 0.74% | 5,746,685 | 22.6% |
[ 0.5% - 1.0% ] 0.89% | 4,789,132 | 23.2% |
[ 1.0% - 1.5% ] 1.04% | 3,490,005 | 23.3% |
[ 1.0% - 1.5% ] 1.16% | 3,516,175 | 21.0% |
[ 1.0% - 1.5% ] 1.30% | 2,592,676 | 21.2% |
[ 1.0% - 1.5% ] 1.42% | 1,671,932 | 19.7% |
[ 1.5% - 2.0% ] 1.57% | 1,947,506 | 20.1% |
[ 1.5% - 2.0% ] 1.70% | 1,527,151 | 19.4% |
[ 1.5% - 2.0% ] 1.89% | 10,071,061 | 15.3% |
[ 1.5% - 2.0% ] 1.96% | 1,079,194 | 22.5% |
[ 2.0% - 2.5% ] 2.12% | 1,081,102 | 18.4% |
[ 2.0% - 2.5% ] 2.26% | 646,832 | 19.5% |
[ 2.0% - 2.5% ] 2.38% | 426,617 | 21.3% |
[ 2.5% - 3.0% ] 2.52% | 583,100 | 16.1% |
[ 2.5% - 3.0% ] 2.66% | 718,465 | 20.4% |
[ 2.5% - 3.0% ] 2.80% | 254,203 | 16.7% |
[ 2.5% - 3.0% ] 2.95% | 436,077 | 20.6% |
[ 3.0% - 3.5% ] 3.08% | 253,880 | 18.0% |
[ 3.0% - 3.5% ] 3.21% | 376,022 | 20.5% |
[ 3.0% - 3.5% ] 3.35% | 455,972 | 16.4% |
[ 3.0% - 3.5% ] 3.48% | 471,391 | 18.4% |
[ 3.5% - 4.0% ] 3.58% | 318,385 | 14.6% |
[ 3.5% - 4.0% ] 3.74% | 206,681 | 22.5% |
[ 3.5% - 4.0% ] 3.89% | 185,390 | 23.6% |
[ 4.0% - 4.5% ] 4.04% | 272,003 | 15.2% |
[ 4.0% - 4.5% ] 4.18% | 225,233 | 19.8% |
[ 4.0% - 4.5% ] 4.31% | 124,062 | 21.2% |
[ 4.0% - 4.5% ] 4.41% | 234,007 | 15.4% |
[ 4.5% - 5.0% ] 4.55% | 232,772 | 17.2% |
[ 4.5% - 5.0% ] 4.69% | 165,396 | 23.5% |
[ 4.5% - 5.0% ] 4.82% | 50,101 | 17.8% |
[ 4.5% - 5.0% ] 5.00% | 287,362 | 12.1% |
[ 5.0% - 5.5% ] 5.11% | 175,410 | 23.3% |
[ 5.0% - 5.5% ] 5.29% | 44,407 | 43.0% |
[ 5.0% - 5.5% ] 5.37% | 135,265 | 13.1% |
[ 5.5% - 6.0% ] 5.53% | 133,648 | 12.7% |
[ 5.5% - 6.0% ] 5.69% | 287,576 | 10.0% |
[ 5.5% - 6.0% ] 5.83% | 149,816 | 17.1% |
[ 5.5% - 6.0% ] 5.89% | 129,918 | 18.2% |
[ 6.0% - 6.5% ] 6.04% | 47,505 | 10.1% |
[ 6.0% - 6.5% ] 6.20% | 52,257 | 21.6% |
[ 6.0% - 6.5% ] 6.32% | 66,937 | 21.5% |
[ 6.5% - 7.0% ] 6.58% | 122,164 | 18.5% |
[ 6.5% - 7.0% ] 6.70% | 92,706 | 19.9% |
[ 6.5% - 7.0% ] 6.88% | 61,738 | 12.4% |
[ 6.5% - 7.0% ] 6.97% | 43,908 | 7.1% |
[ 7.0% - 7.5% ] 7.21% | 146,869 | 9.3% |
[ 7.0% - 7.5% ] 7.33% | 226,738 | 18.8% |
[ 7.0% - 7.5% ] 7.45% | 146,631 | 10.9% |
[ 7.5% - 8.0% ] 7.60% | 17,178 | 18.4% |
[ 7.5% - 8.0% ] 7.86% | 175,260 | 16.8% |
[ 7.5% - 8.0% ] 7.94% | 136,315 | 10.0% |
[ 8.0% - 8.5% ] 8.42% | 71,578 | 18.7% |
[ 8.5% - 9.0% ] 8.58% | 2,867 | 43.2% |
[ 8.5% - 9.0% ] 8.67% | 221,580 | 16.5% |
[ 8.5% - 9.0% ] 8.78% | 2,233 | 23.4% |
[ 9.0% - 9.5% ] 9.10% | 22,099 | 22.1% |
[ 9.0% - 9.5% ] 9.33% | 847 | 9.6% |
[ 9.0% - 9.5% ] 9.48% | 43,517 | 11.6% |
[ 9.5% - 10.0% ] 9.65% | 4,674 | 27.6% |
[ 10.0% - 10.5% ] 10.24% | 13,781 | 14.8% |
[ 10.0% - 10.5% ] 10.50% | 543 | 38.2% |
[ 10.5% - 11.0% ] 10.88% | 79,161 | 4.2% |
[ 10.5% - 11.0% ] 10.98% | 24,341 | 19.1% |
[ 12.0% - 12.5% ] 12.32% | 68,182 | 14.8% |
[ 12.5% - 13.0% ] 12.63% | 128,695 | 5.0% |
[ 13.5% - 14.0% ] 13.81% | 71,862 | 3.2% |
[ 14.0% - 14.5% ] 14.01% | 32,296 | 8.8% |
[ 14.0% - 14.5% ] 14.12% | 21,329 | 8.4% |
[ 14.5% - 15.0% ] 14.81% | 117,452 | 12.2% |
[ 14.5% - 15.0% ] 14.93% | 40,593 | 7.9% |
[ 15.0% - 15.5% ] 15.27% | 62,232 | 12.3% |
[ 15.5% - 16.0% ] 15.63% | 52,792 | 14.0% |
[ 16.0% - 16.5% ] 16.14% | 72,273 | 11.9% |
[ 16.5% - 17.0% ] 16.72% | 84,905 | 7.0% |
[ 16.5% - 17.0% ] 16.98% | 73,987 | 5.6% |
[ 18.5% - 19.0% ] 18.73% | 35,914 | 18.6% |
[ 19.0% - 19.5% ] 19.17% | 52,000 | 4.0% |
[ 19.0% - 19.5% ] 19.50% | 21,977 | 16.3% |
[ 19.5% - 20.0% ] 19.78% | 10,526 | 21.4% |
[ 20.0% - 20.5% ] 20.19% | 852 | 8.7% |
[ 27.0% - 27.5% ] 27.29% | 2,224 | 10.6% |