Immigrants from Jamaica GED/Equivalency
COMPARE
Immigrants from Jamaica
Select to Compare
GED/Equivalency
Immigrants from Jamaica GED/Equivalency
82.9%
GED/EQUIVALENCY
0.2/ 100
METRIC RATING
270th/ 347
METRIC RANK
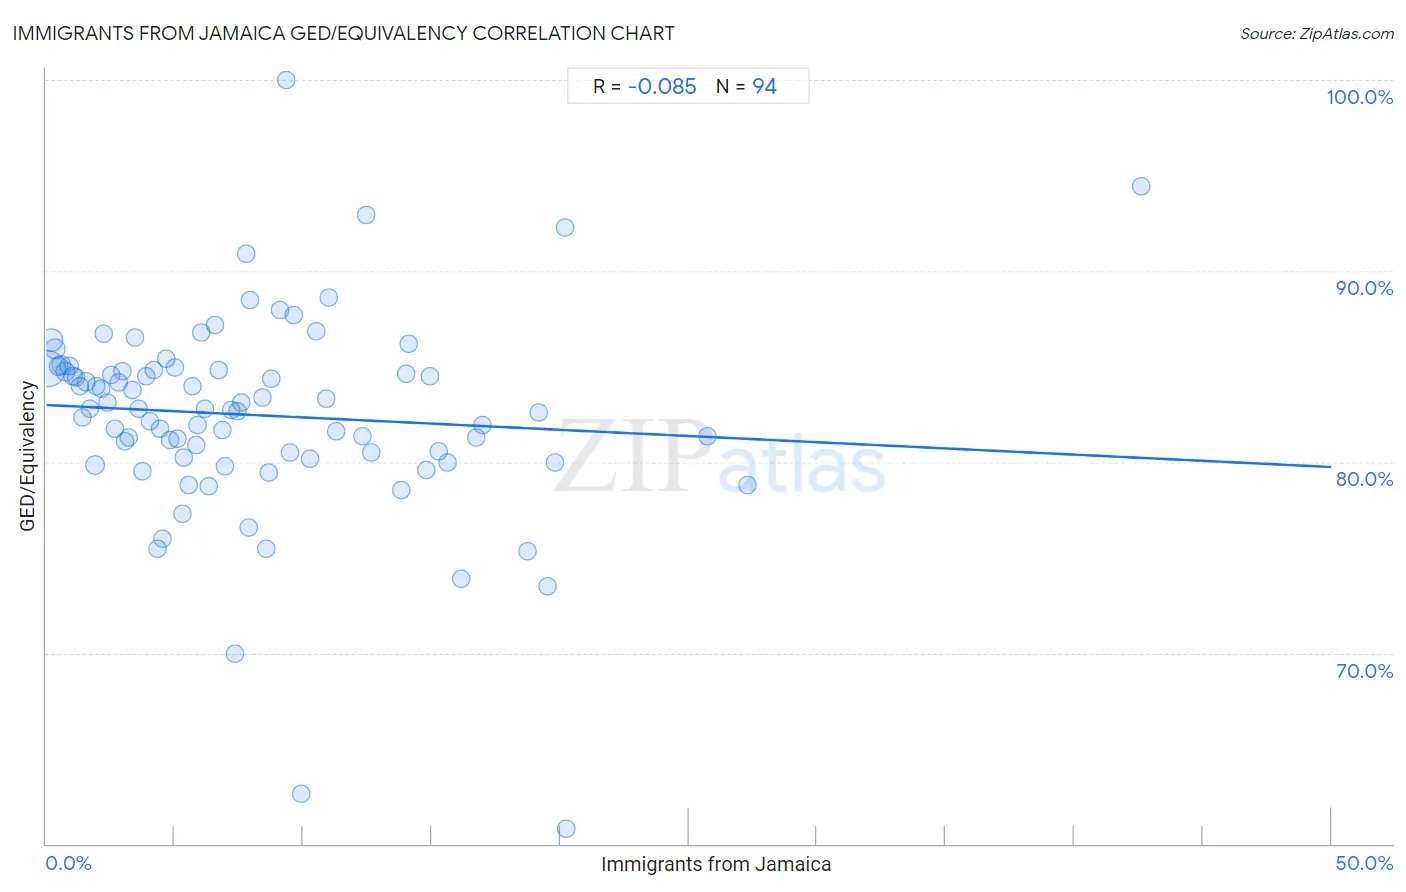
Immigrants from Jamaica GED/Equivalency Correlation Chart
The statistical analysis conducted on geographies consisting of 301,829,399 people shows a slight negative correlation between the proportion of Immigrants from Jamaica and percentage of population with at least ged/equivalency education in the United States with a correlation coefficient (R) of -0.085 and weighted average of 82.9%. On average, for every 1% (one percent) increase in Immigrants from Jamaica within a typical geography, there is a decrease of 0.065% in percentage of population with at least ged/equivalency education.
It is essential to understand that the correlation between the percentage of Immigrants from Jamaica and percentage of population with at least ged/equivalency education does not imply a direct cause-and-effect relationship. It remains uncertain whether the presence of Immigrants from Jamaica influences an upward or downward trend in the level of percentage of population with at least ged/equivalency education within an area, or if Immigrants from Jamaica simply ended up residing in those areas with higher or lower levels of percentage of population with at least ged/equivalency education due to other factors.
Demographics Similar to Immigrants from Jamaica by GED/Equivalency
In terms of ged/equivalency, the demographic groups most similar to Immigrants from Jamaica are U.S. Virgin Islander (82.9%, a difference of 0.040%), Hopi (83.0%, a difference of 0.050%), Barbadian (82.9%, a difference of 0.080%), Pennsylvania German (82.9%, a difference of 0.090%), and Immigrants from Burma/Myanmar (83.0%, a difference of 0.10%).
| Demographics | Rating | Rank | GED/Equivalency |
| Immigrants from Congo | 0.2 /100 | #263 | Tragic 83.1% |
| Bangladeshis | 0.2 /100 | #264 | Tragic 83.1% |
| West Indians | 0.2 /100 | #265 | Tragic 83.1% |
| Kiowa | 0.2 /100 | #266 | Tragic 83.1% |
| Trinidadians and Tobagonians | 0.2 /100 | #267 | Tragic 83.0% |
| Immigrants from Burma/Myanmar | 0.2 /100 | #268 | Tragic 83.0% |
| Hopi | 0.2 /100 | #269 | Tragic 83.0% |
| Immigrants from Jamaica | 0.2 /100 | #270 | Tragic 82.9% |
| U.S. Virgin Islanders | 0.2 /100 | #271 | Tragic 82.9% |
| Barbadians | 0.1 /100 | #272 | Tragic 82.9% |
| Pennsylvania Germans | 0.1 /100 | #273 | Tragic 82.9% |
| Immigrants from Trinidad and Tobago | 0.1 /100 | #274 | Tragic 82.8% |
| Seminole | 0.1 /100 | #275 | Tragic 82.8% |
| Blacks/African Americans | 0.1 /100 | #276 | Tragic 82.8% |
| Arapaho | 0.1 /100 | #277 | Tragic 82.8% |
Immigrants from Jamaica GED/Equivalency Correlation Summary
| Measurement | Immigrants from Jamaica Data | GED/Equivalency Data |
| Minimum | 0.055% | 60.8% |
| Maximum | 42.6% | 100.0% |
| Range | 42.5% | 39.2% |
| Mean | 8.2% | 82.4% |
| Median | 6.5% | 82.8% |
| Interquartile 25% (IQ1) | 3.2% | 80.2% |
| Interquartile 75% (IQ3) | 11.0% | 84.8% |
| Interquartile Range (IQR) | 7.8% | 4.6% |
| Standard Deviation (Sample) | 7.0% | 5.4% |
| Standard Deviation (Population) | 7.0% | 5.3% |
Correlation Details
| Immigrants from Jamaica Percentile | Sample Size | GED/Equivalency |
[ 0.0% - 0.5% ] 0.055% | 167,410,068 | 84.9% |
[ 0.0% - 0.5% ] 0.19% | 41,894,713 | 86.4% |
[ 0.0% - 0.5% ] 0.33% | 20,511,257 | 85.9% |
[ 0.0% - 0.5% ] 0.47% | 12,821,822 | 85.0% |
[ 0.5% - 1.0% ] 0.61% | 10,856,301 | 85.1% |
[ 0.5% - 1.0% ] 0.74% | 5,761,898 | 84.7% |
[ 0.5% - 1.0% ] 0.89% | 4,794,778 | 85.0% |
[ 1.0% - 1.5% ] 1.04% | 3,494,502 | 84.5% |
[ 1.0% - 1.5% ] 1.16% | 3,520,237 | 84.4% |
[ 1.0% - 1.5% ] 1.30% | 2,596,037 | 84.0% |
[ 1.0% - 1.5% ] 1.42% | 1,673,047 | 82.3% |
[ 1.5% - 2.0% ] 1.57% | 1,949,166 | 84.2% |
[ 1.5% - 2.0% ] 1.70% | 1,528,360 | 82.8% |
[ 1.5% - 2.0% ] 1.89% | 10,072,175 | 79.9% |
[ 1.5% - 2.0% ] 1.96% | 1,082,965 | 84.0% |
[ 2.0% - 2.5% ] 2.12% | 1,083,367 | 83.8% |
[ 2.0% - 2.5% ] 2.26% | 647,271 | 86.7% |
[ 2.0% - 2.5% ] 2.38% | 428,650 | 83.1% |
[ 2.5% - 3.0% ] 2.52% | 584,188 | 84.6% |
[ 2.5% - 3.0% ] 2.66% | 720,416 | 81.7% |
[ 2.5% - 3.0% ] 2.80% | 254,203 | 84.1% |
[ 2.5% - 3.0% ] 2.95% | 440,940 | 84.8% |
[ 3.0% - 3.5% ] 3.08% | 254,553 | 81.1% |
[ 3.0% - 3.5% ] 3.21% | 376,547 | 81.3% |
[ 3.0% - 3.5% ] 3.35% | 455,972 | 83.8% |
[ 3.0% - 3.5% ] 3.48% | 471,391 | 86.5% |
[ 3.5% - 4.0% ] 3.58% | 318,849 | 82.8% |
[ 3.5% - 4.0% ] 3.74% | 206,681 | 79.5% |
[ 3.5% - 4.0% ] 3.89% | 187,534 | 84.5% |
[ 4.0% - 4.5% ] 4.04% | 272,053 | 82.1% |
[ 4.0% - 4.5% ] 4.18% | 225,890 | 84.8% |
[ 4.0% - 4.5% ] 4.31% | 124,062 | 75.5% |
[ 4.0% - 4.5% ] 4.41% | 234,007 | 81.7% |
[ 4.5% - 5.0% ] 4.55% | 232,772 | 76.0% |
[ 4.5% - 5.0% ] 4.69% | 165,879 | 85.4% |
[ 4.5% - 5.0% ] 4.82% | 52,463 | 81.2% |
[ 4.5% - 5.0% ] 5.00% | 287,362 | 84.9% |
[ 5.0% - 5.5% ] 5.11% | 175,410 | 81.2% |
[ 5.0% - 5.5% ] 5.29% | 44,522 | 77.3% |
[ 5.0% - 5.5% ] 5.37% | 135,748 | 80.2% |
[ 5.5% - 6.0% ] 5.53% | 133,648 | 78.8% |
[ 5.5% - 6.0% ] 5.69% | 287,576 | 83.9% |
[ 5.5% - 6.0% ] 5.83% | 149,955 | 80.9% |
[ 5.5% - 6.0% ] 5.89% | 129,918 | 81.9% |
[ 6.0% - 6.5% ] 6.04% | 47,505 | 86.8% |
[ 6.0% - 6.5% ] 6.20% | 52,257 | 82.8% |
[ 6.0% - 6.5% ] 6.32% | 67,094 | 78.7% |
[ 6.5% - 7.0% ] 6.58% | 122,855 | 87.2% |
[ 6.5% - 7.0% ] 6.70% | 92,706 | 84.8% |
[ 6.5% - 7.0% ] 6.88% | 62,464 | 81.7% |
[ 6.5% - 7.0% ] 6.97% | 44,321 | 79.8% |
[ 7.0% - 7.5% ] 7.21% | 146,869 | 82.7% |
[ 7.0% - 7.5% ] 7.33% | 226,738 | 69.9% |
[ 7.0% - 7.5% ] 7.45% | 146,631 | 82.7% |
[ 7.5% - 8.0% ] 7.60% | 17,178 | 83.1% |
[ 7.5% - 8.0% ] 7.77% | 927 | 90.9% |
[ 7.5% - 8.0% ] 7.86% | 175,260 | 76.6% |
[ 7.5% - 8.0% ] 7.94% | 136,315 | 88.5% |
[ 8.0% - 8.5% ] 8.42% | 73,006 | 83.4% |
[ 8.5% - 9.0% ] 8.58% | 2,949 | 75.4% |
[ 8.5% - 9.0% ] 8.67% | 221,580 | 79.5% |
[ 8.5% - 9.0% ] 8.78% | 2,233 | 84.3% |
[ 9.0% - 9.5% ] 9.10% | 22,099 | 88.0% |
[ 9.0% - 9.5% ] 9.33% | 847 | 100.0% |
[ 9.0% - 9.5% ] 9.48% | 44,047 | 80.5% |
[ 9.5% - 10.0% ] 9.65% | 4,674 | 87.7% |
[ 9.5% - 10.0% ] 9.94% | 161 | 62.6% |
[ 10.0% - 10.5% ] 10.24% | 13,781 | 80.2% |
[ 10.0% - 10.5% ] 10.50% | 543 | 86.8% |
[ 10.5% - 11.0% ] 10.88% | 79,161 | 83.3% |
[ 10.5% - 11.0% ] 10.98% | 24,341 | 88.6% |
[ 11.0% - 11.5% ] 11.29% | 638 | 81.6% |
[ 12.0% - 12.5% ] 12.32% | 68,182 | 81.3% |
[ 12.0% - 12.5% ] 12.44% | 201 | 92.9% |
[ 12.5% - 13.0% ] 12.63% | 128,695 | 80.5% |
[ 13.5% - 14.0% ] 13.81% | 71,862 | 78.5% |
[ 14.0% - 14.5% ] 14.01% | 32,296 | 84.6% |
[ 14.0% - 14.5% ] 14.12% | 21,329 | 86.2% |
[ 14.5% - 15.0% ] 14.81% | 117,452 | 79.6% |
[ 14.5% - 15.0% ] 14.93% | 40,593 | 84.5% |
[ 15.0% - 15.5% ] 15.27% | 62,232 | 80.5% |
[ 15.5% - 16.0% ] 15.63% | 52,792 | 80.0% |
[ 16.0% - 16.5% ] 16.14% | 72,273 | 73.9% |
[ 16.5% - 17.0% ] 16.72% | 84,905 | 81.3% |
[ 16.5% - 17.0% ] 16.98% | 73,987 | 82.0% |
[ 18.5% - 19.0% ] 18.73% | 35,914 | 75.3% |
[ 19.0% - 19.5% ] 19.17% | 52,000 | 82.6% |
[ 19.0% - 19.5% ] 19.50% | 21,977 | 73.5% |
[ 19.5% - 20.0% ] 19.78% | 10,526 | 80.0% |
[ 20.0% - 20.5% ] 20.19% | 852 | 92.3% |
[ 20.0% - 20.5% ] 20.25% | 79 | 60.8% |
[ 25.5% - 26.0% ] 25.74% | 641 | 81.4% |
[ 27.0% - 27.5% ] 27.29% | 2,224 | 78.8% |
[ 42.5% - 43.0% ] 42.59% | 54 | 94.4% |