Zip Codes with the Highest Percentage of Families with Income Below $10,000 in Silverdale, WA
RELATED REPORTS & OPTIONS
Family Income | $0-10k
Silverdale
Compare Zip Codes
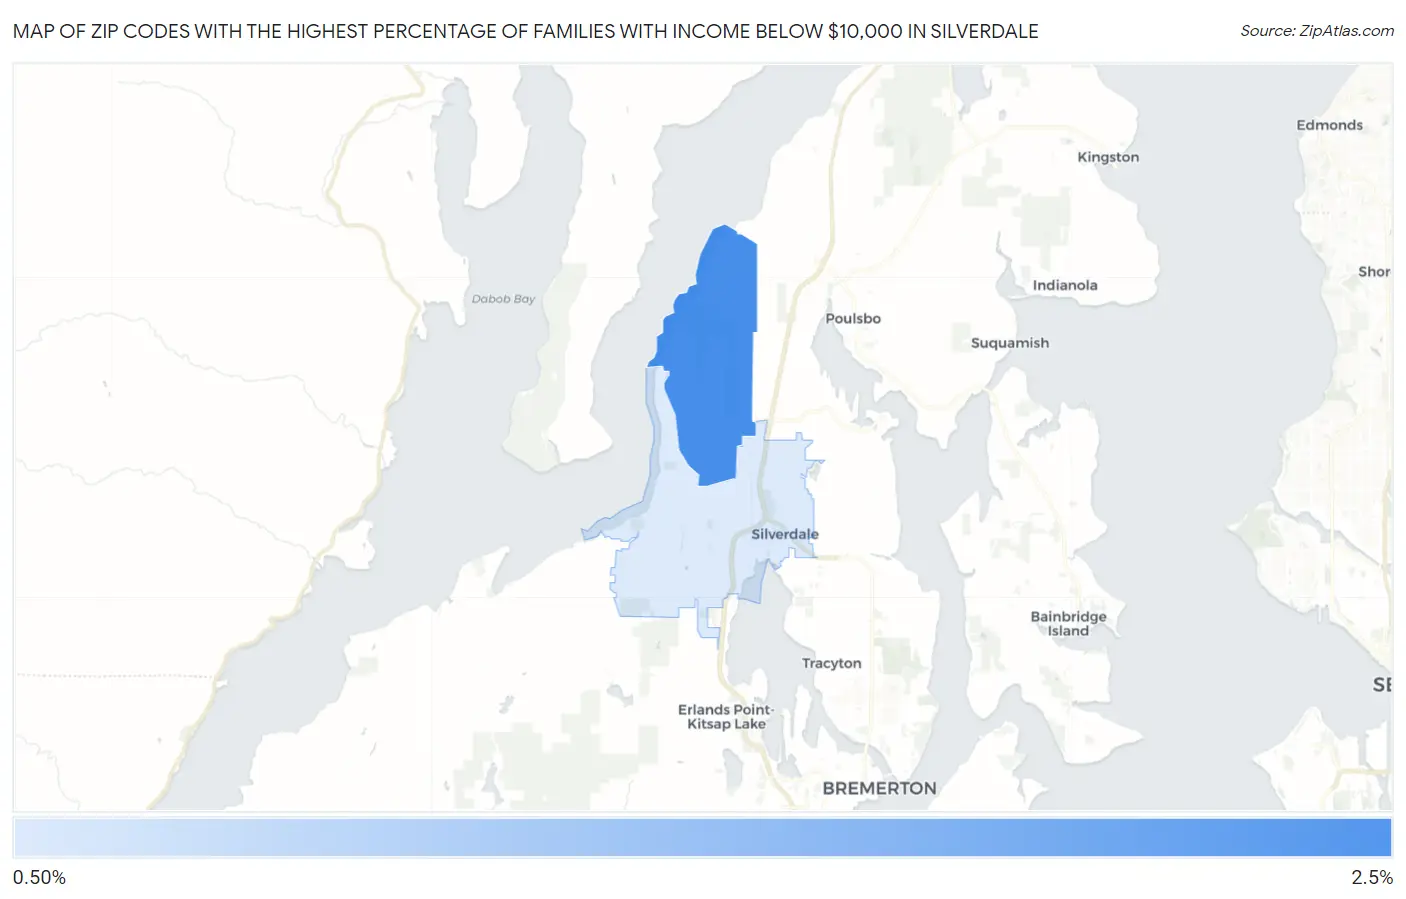
Map of Zip Codes with the Highest Percentage of Families with Income Below $10,000 in Silverdale
1.5%
2.1%
Zip Codes with the Highest Percentage of Families with Income Below $10,000 in Silverdale, WA
| Zip Code | Families with Income < $10k | vs State | vs National | |
| 1. | 98315 | 2.1% | 2.4%(-0.300)#261 | 3.1%(-1.000)#15,024 |
| 2. | 98383 | 1.5% | 2.4%(-0.900)#334 | 3.1%(-1.60)#17,784 |
1
Common Questions
What are the Top Zip Codes with the Highest Percentage of Families with Income Below $10,000 in Silverdale, WA?
Top Zip Codes with the Highest Percentage of Families with Income Below $10,000 in Silverdale, WA are:
What zip code has the Highest Percentage of Families with Income Below $10,000 in Silverdale, WA?
98315 has the Highest Percentage of Families with Income Below $10,000 in Silverdale, WA with 2.1%.
What is the Percentage of Families with Income Below $10,000 in Silverdale, WA?
Percentage of Families with Income Below $10,000 in Silverdale is 2.4%.
What is the Percentage of Families with Income Below $10,000 in Washington?
Percentage of Families with Income Below $10,000 in Washington is 2.4%.
What is the Percentage of Families with Income Below $10,000 in the United States?
Percentage of Families with Income Below $10,000 in the United States is 3.1%.