Zip Codes with the Highest Percentage of Private Company Employees in Silverdale, WA
RELATED REPORTS & OPTIONS
Private Company Employees
Silverdale
Compare Zip Codes
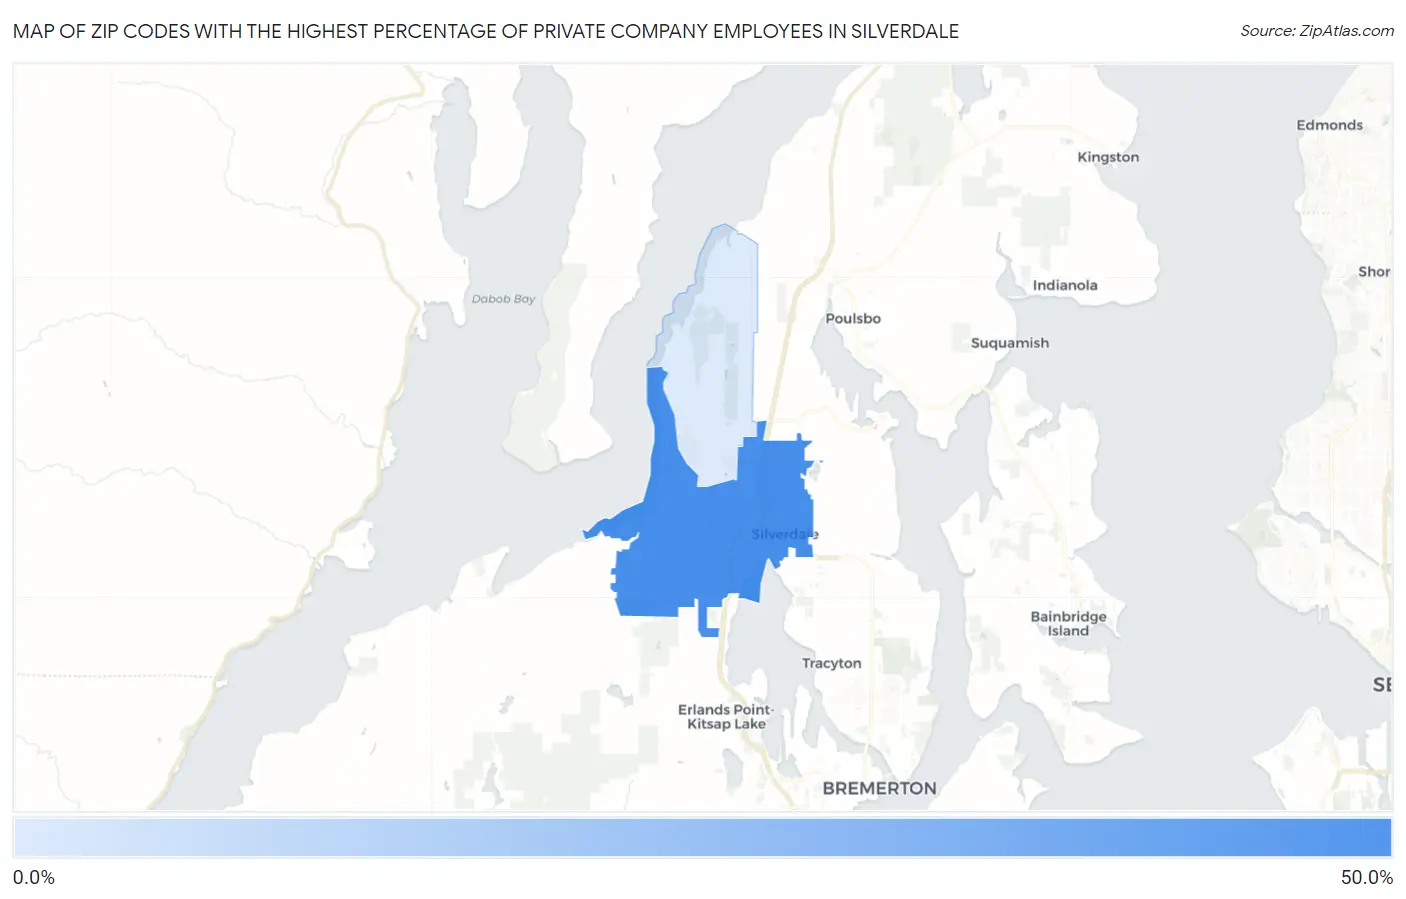
Map of Zip Codes with the Highest Percentage of Private Company Employees in Silverdale
7.0%
43.8%
Zip Codes with the Highest Percentage of Private Company Employees in Silverdale, WA
| Zip Code | % Private Company Employees | vs State | vs National | |
| 1. | 98383 | 43.8% | 65.1%(-21.3)#506 | 66.9%(-23.1)#30,084 |
| 2. | 98315 | 7.0% | 65.1%(-58.1)#577 | 66.9%(-59.9)#32,375 |
1
Common Questions
What are the Top Zip Codes with the Highest Percentage of Private Company Employees in Silverdale, WA?
Top Zip Codes with the Highest Percentage of Private Company Employees in Silverdale, WA are:
What zip code has the Highest Percentage of Private Company Employees in Silverdale, WA?
98383 has the Highest Percentage of Private Company Employees in Silverdale, WA with 43.8%.
What is the Percentage of Private Company Employees in Silverdale, WA?
Percentage of Private Company Employees in Silverdale is 44.4%.
What is the Percentage of Private Company Employees in Washington?
Percentage of Private Company Employees in Washington is 65.1%.
What is the Percentage of Private Company Employees in the United States?
Percentage of Private Company Employees in the United States is 66.9%.