Zip Codes with the Most Immigrants from Caribbean in Silverdale, WA
RELATED REPORTS & OPTIONS
Caribbean
Silverdale
Compare Zip Codes
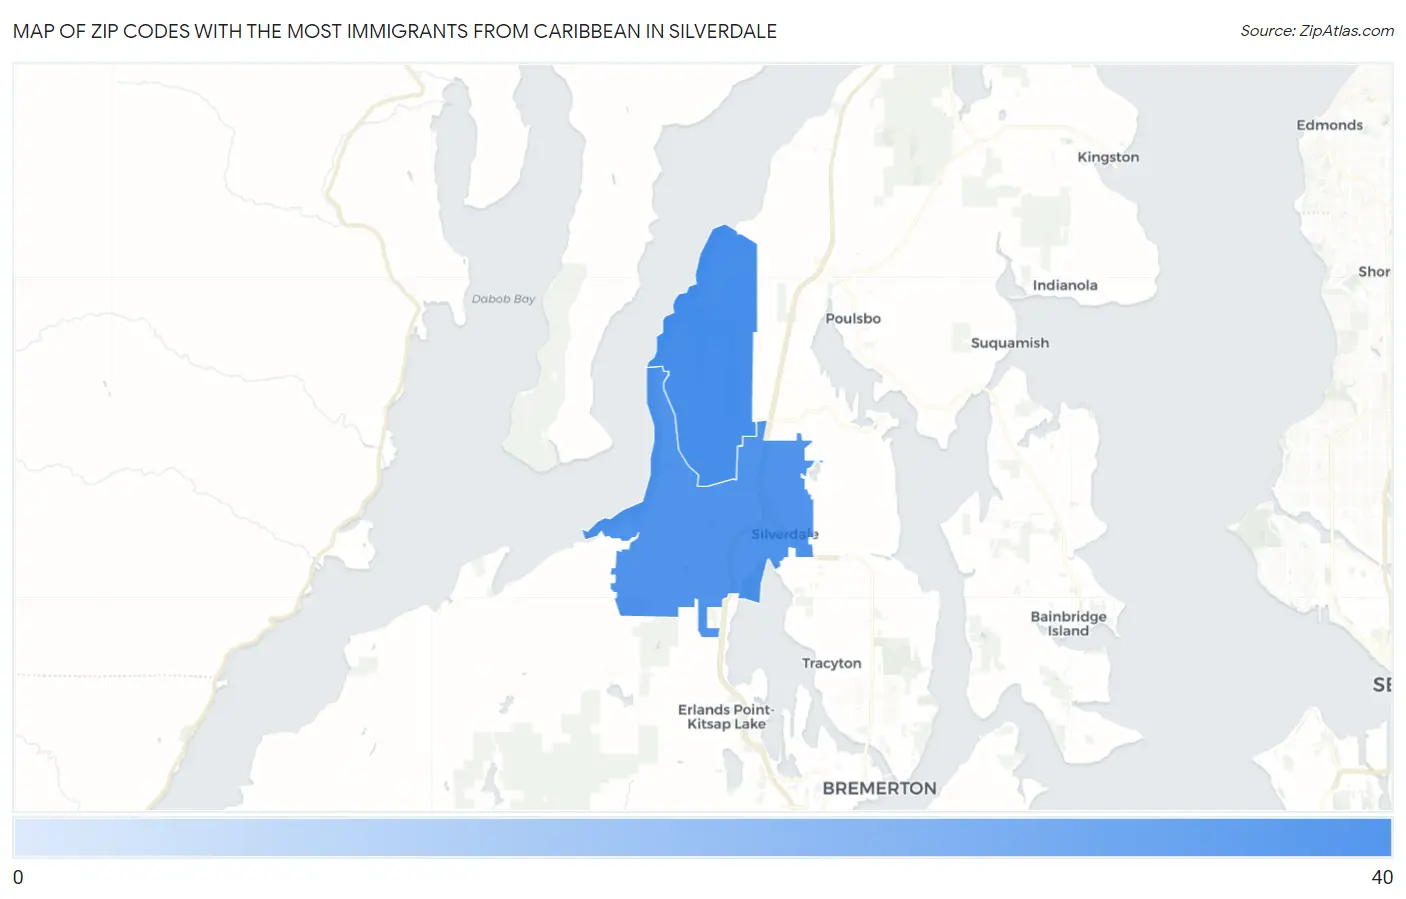
Map of Zip Codes with the Most Immigrants from Caribbean in Silverdale
32
37
Zip Codes with the Most Immigrants from Caribbean in Silverdale, WA
| Zip Code | Caribbean | vs State | vs National | |
| 1. | 98315 | 37 | 12,627(0.29%)#94 | 4,544,093(0.00%)#6,101 |
| 2. | 98383 | 32 | 12,627(0.25%)#104 | 4,544,093(0.00%)#6,414 |
1
Common Questions
What are the Top Zip Codes with the Most Immigrants from Caribbean in Silverdale, WA?
Top Zip Codes with the Most Immigrants from Caribbean in Silverdale, WA are:
What zip code has the Most Immigrants from Caribbean in Silverdale, WA?
98315 has the Most Immigrants from Caribbean in Silverdale, WA with 37.
What is the Total Immigrants from Caribbean in Silverdale, WA?
Total Immigrants from Caribbean in Silverdale is 32.
What is the Total Immigrants from Caribbean in Washington?
Total Immigrants from Caribbean in Washington is 12,627.
What is the Total Immigrants from Caribbean in the United States?
Total Immigrants from Caribbean in the United States is 4,544,093.