Zip Codes with the Most Immigrants from Philippines in Silverdale, WA
RELATED REPORTS & OPTIONS
Philippines
Silverdale
Compare Zip Codes
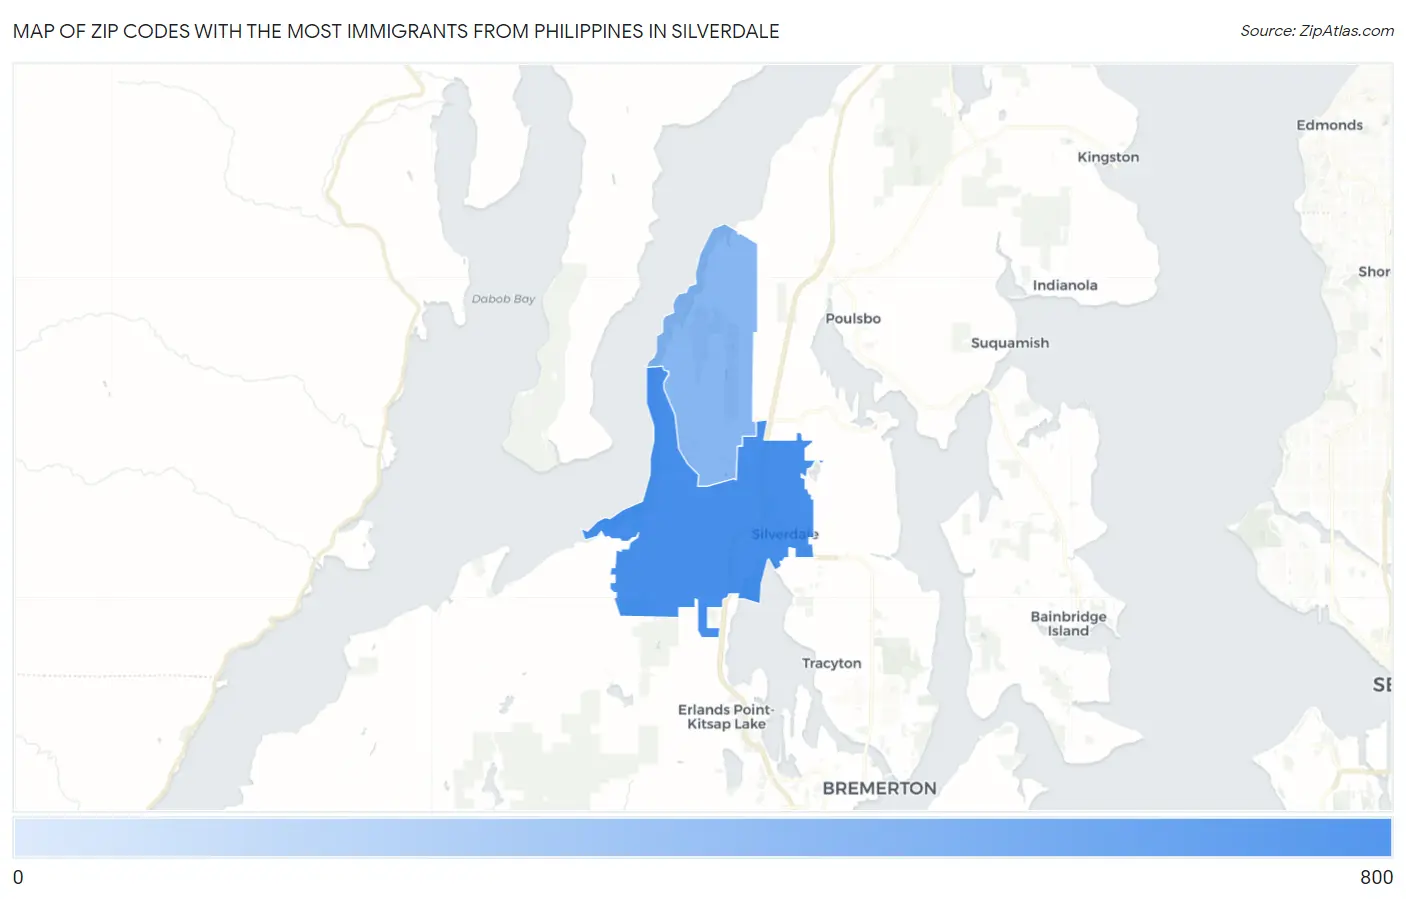
Map of Zip Codes with the Most Immigrants from Philippines in Silverdale
42
771
Zip Codes with the Most Immigrants from Philippines in Silverdale, WA
| Zip Code | Philippines | vs State | vs National | |
| 1. | 98383 | 771 | 71,661(1.08%)#26 | 1,985,710(0.04%)#514 |
| 2. | 98315 | 42 | 71,661(0.06%)#212 | 1,985,710(0.00%)#5,683 |
1
Common Questions
What are the Top Zip Codes with the Most Immigrants from Philippines in Silverdale, WA?
Top Zip Codes with the Most Immigrants from Philippines in Silverdale, WA are:
What zip code has the Most Immigrants from Philippines in Silverdale, WA?
98383 has the Most Immigrants from Philippines in Silverdale, WA with 771.
What is the Total Immigrants from Philippines in Silverdale, WA?
Total Immigrants from Philippines in Silverdale is 779.
What is the Total Immigrants from Philippines in Washington?
Total Immigrants from Philippines in Washington is 71,661.
What is the Total Immigrants from Philippines in the United States?
Total Immigrants from Philippines in the United States is 1,985,710.