Immigrants from Belize vs Hispanic or Latino 2 or more Vehicles in Household
COMPARE
Immigrants from Belize
Hispanic or Latino
2 or more Vehicles in Household
2 or more Vehicles in Household Comparison
Immigrants from Belize
Hispanics or Latinos
49.9%
2 OR MORE VEHICLES IN HOUSEHOLD
0.0/ 100
METRIC RATING
304th/ 347
METRIC RANK
57.9%
2 OR MORE VEHICLES IN HOUSEHOLD
99.0/ 100
METRIC RATING
90th/ 347
METRIC RANK
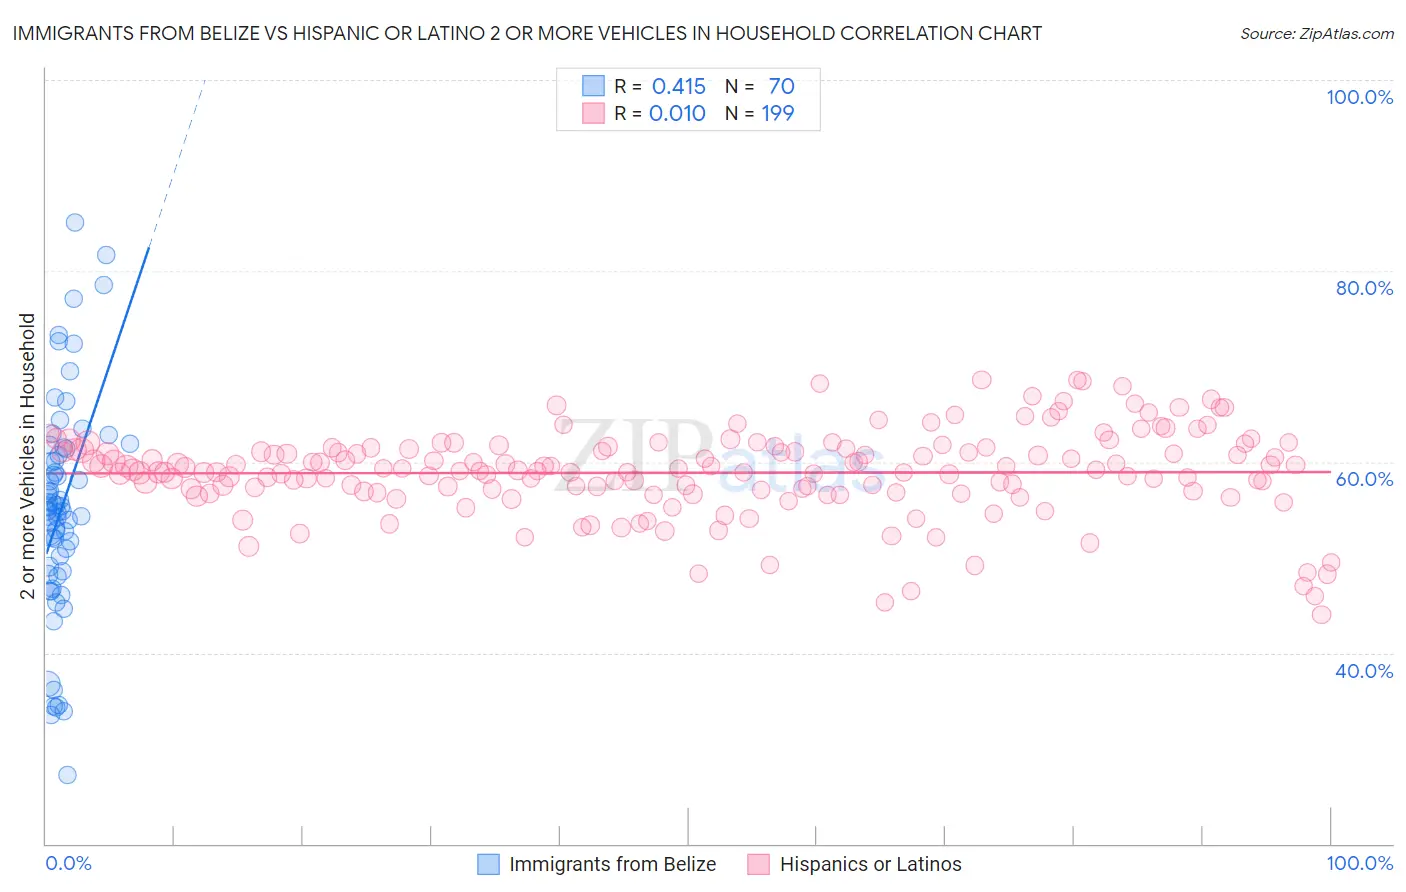
Immigrants from Belize vs Hispanic or Latino 2 or more Vehicles in Household Correlation Chart
The statistical analysis conducted on geographies consisting of 130,296,303 people shows a moderate positive correlation between the proportion of Immigrants from Belize and percentage of households with 2 or more vehicles available in the United States with a correlation coefficient (R) of 0.415 and weighted average of 49.9%. Similarly, the statistical analysis conducted on geographies consisting of 560,775,190 people shows no correlation between the proportion of Hispanics or Latinos and percentage of households with 2 or more vehicles available in the United States with a correlation coefficient (R) of 0.010 and weighted average of 57.9%, a difference of 16.0%.
2 or more Vehicles in Household Correlation Summary
| Measurement | Immigrants from Belize | Hispanic or Latino |
| Minimum | 27.2% | 44.0% |
| Maximum | 85.1% | 68.6% |
| Range | 57.9% | 24.6% |
| Mean | 55.1% | 58.9% |
| Median | 55.1% | 59.1% |
| Interquartile 25% (IQ1) | 48.6% | 56.9% |
| Interquartile 75% (IQ3) | 61.4% | 61.4% |
| Interquartile Range (IQR) | 12.9% | 4.5% |
| Standard Deviation (Sample) | 11.6% | 4.5% |
| Standard Deviation (Population) | 11.5% | 4.5% |
Similar Demographics by 2 or more Vehicles in Household
Demographics Similar to Immigrants from Belize by 2 or more Vehicles in Household
In terms of 2 or more vehicles in household, the demographic groups most similar to Immigrants from Belize are Tohono O'odham (50.0%, a difference of 0.20%), Immigrants from South America (50.2%, a difference of 0.57%), Immigrants from Greece (50.2%, a difference of 0.63%), Immigrants from Russia (50.3%, a difference of 0.81%), and Immigrants from Morocco (50.3%, a difference of 0.85%).
| Demographics | Rating | Rank | 2 or more Vehicles in Household |
| Immigrants | Spain | 0.0 /100 | #297 | Tragic 50.4% |
| Paraguayans | 0.0 /100 | #298 | Tragic 50.3% |
| Immigrants | Morocco | 0.0 /100 | #299 | Tragic 50.3% |
| Immigrants | Russia | 0.0 /100 | #300 | Tragic 50.3% |
| Immigrants | Greece | 0.0 /100 | #301 | Tragic 50.2% |
| Immigrants | South America | 0.0 /100 | #302 | Tragic 50.2% |
| Tohono O'odham | 0.0 /100 | #303 | Tragic 50.0% |
| Immigrants | Belize | 0.0 /100 | #304 | Tragic 49.9% |
| Immigrants | Western Africa | 0.0 /100 | #305 | Tragic 49.4% |
| Immigrants | Israel | 0.0 /100 | #306 | Tragic 49.2% |
| Hopi | 0.0 /100 | #307 | Tragic 49.0% |
| Albanians | 0.0 /100 | #308 | Tragic 49.0% |
| Moroccans | 0.0 /100 | #309 | Tragic 48.8% |
| Ghanaians | 0.0 /100 | #310 | Tragic 48.0% |
| Immigrants | Belarus | 0.0 /100 | #311 | Tragic 47.9% |
Demographics Similar to Hispanics or Latinos by 2 or more Vehicles in Household
In terms of 2 or more vehicles in household, the demographic groups most similar to Hispanics or Latinos are Immigrants from Germany (57.9%, a difference of 0.0%), Pakistani (57.9%, a difference of 0.030%), Shoshone (57.9%, a difference of 0.050%), Ottawa (57.9%, a difference of 0.060%), and Immigrants from Iran (57.9%, a difference of 0.070%).
| Demographics | Rating | Rank | 2 or more Vehicles in Household |
| Icelanders | 99.2 /100 | #83 | Exceptional 58.0% |
| Maltese | 99.2 /100 | #84 | Exceptional 58.0% |
| Slovaks | 99.2 /100 | #85 | Exceptional 58.0% |
| Potawatomi | 99.1 /100 | #86 | Exceptional 58.0% |
| Thais | 99.1 /100 | #87 | Exceptional 57.9% |
| Immigrants | Iran | 99.1 /100 | #88 | Exceptional 57.9% |
| Immigrants | Germany | 99.0 /100 | #89 | Exceptional 57.9% |
| Hispanics or Latinos | 99.0 /100 | #90 | Exceptional 57.9% |
| Pakistanis | 99.0 /100 | #91 | Exceptional 57.9% |
| Shoshone | 99.0 /100 | #92 | Exceptional 57.9% |
| Ottawa | 99.0 /100 | #93 | Exceptional 57.9% |
| Filipinos | 98.9 /100 | #94 | Exceptional 57.8% |
| Hmong | 98.9 /100 | #95 | Exceptional 57.8% |
| Burmese | 98.8 /100 | #96 | Exceptional 57.8% |
| Slavs | 98.8 /100 | #97 | Exceptional 57.8% |