Guyanese vs Hispanic or Latino 2 or more Vehicles in Household
COMPARE
Guyanese
Hispanic or Latino
2 or more Vehicles in Household
2 or more Vehicles in Household Comparison
Guyanese
Hispanics or Latinos
35.4%
2 OR MORE VEHICLES IN HOUSEHOLD
0.0/ 100
METRIC RATING
341st/ 347
METRIC RANK
57.9%
2 OR MORE VEHICLES IN HOUSEHOLD
99.0/ 100
METRIC RATING
90th/ 347
METRIC RANK
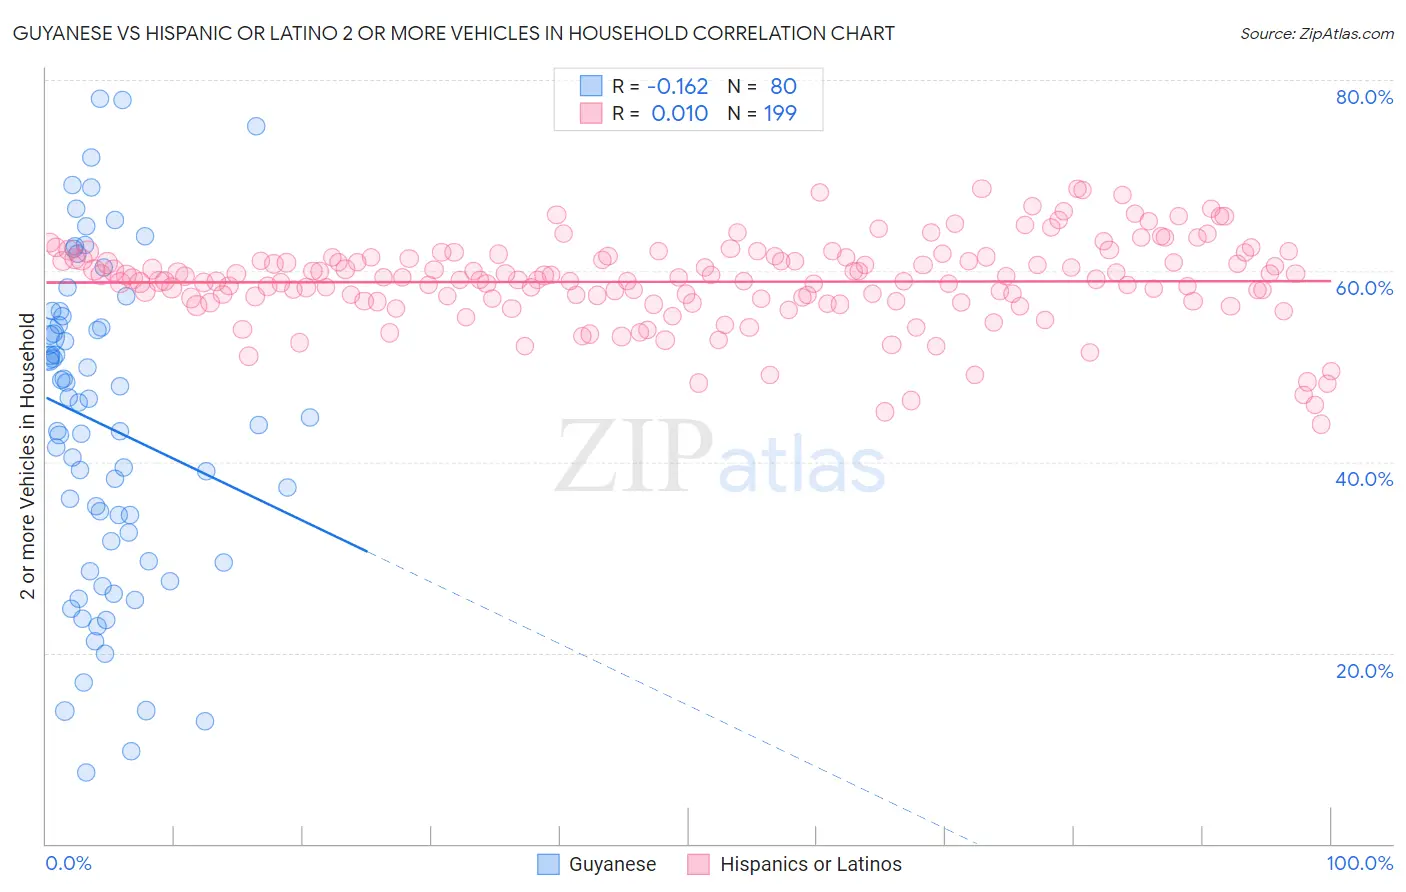
Guyanese vs Hispanic or Latino 2 or more Vehicles in Household Correlation Chart
The statistical analysis conducted on geographies consisting of 176,820,378 people shows a poor negative correlation between the proportion of Guyanese and percentage of households with 2 or more vehicles available in the United States with a correlation coefficient (R) of -0.162 and weighted average of 35.4%. Similarly, the statistical analysis conducted on geographies consisting of 560,775,190 people shows no correlation between the proportion of Hispanics or Latinos and percentage of households with 2 or more vehicles available in the United States with a correlation coefficient (R) of 0.010 and weighted average of 57.9%, a difference of 63.6%.
2 or more Vehicles in Household Correlation Summary
| Measurement | Guyanese | Hispanic or Latino |
| Minimum | 7.4% | 44.0% |
| Maximum | 78.1% | 68.6% |
| Range | 70.6% | 24.6% |
| Mean | 43.9% | 58.9% |
| Median | 45.4% | 59.1% |
| Interquartile 25% (IQ1) | 30.7% | 56.9% |
| Interquartile 75% (IQ3) | 54.8% | 61.4% |
| Interquartile Range (IQR) | 24.2% | 4.5% |
| Standard Deviation (Sample) | 16.8% | 4.5% |
| Standard Deviation (Population) | 16.7% | 4.5% |
Similar Demographics by 2 or more Vehicles in Household
Demographics Similar to Guyanese by 2 or more Vehicles in Household
In terms of 2 or more vehicles in household, the demographic groups most similar to Guyanese are British West Indian (35.4%, a difference of 0.070%), Dominican (35.3%, a difference of 0.18%), Immigrants from Guyana (35.0%, a difference of 1.1%), Immigrants from Barbados (35.8%, a difference of 1.1%), and Yup'ik (34.9%, a difference of 1.2%).
| Demographics | Rating | Rank | 2 or more Vehicles in Household |
| Immigrants | Ecuador | 0.0 /100 | #333 | Tragic 40.5% |
| Immigrants | Trinidad and Tobago | 0.0 /100 | #334 | Tragic 40.3% |
| Immigrants | Bangladesh | 0.0 /100 | #335 | Tragic 38.8% |
| Vietnamese | 0.0 /100 | #336 | Tragic 38.5% |
| Barbadians | 0.0 /100 | #337 | Tragic 38.3% |
| Immigrants | Uzbekistan | 0.0 /100 | #338 | Tragic 37.9% |
| Immigrants | Barbados | 0.0 /100 | #339 | Tragic 35.8% |
| British West Indians | 0.0 /100 | #340 | Tragic 35.4% |
| Guyanese | 0.0 /100 | #341 | Tragic 35.4% |
| Dominicans | 0.0 /100 | #342 | Tragic 35.3% |
| Immigrants | Guyana | 0.0 /100 | #343 | Tragic 35.0% |
| Yup'ik | 0.0 /100 | #344 | Tragic 34.9% |
| Immigrants | Dominican Republic | 0.0 /100 | #345 | Tragic 33.2% |
| Immigrants | St. Vincent and the Grenadines | 0.0 /100 | #346 | Tragic 31.0% |
| Immigrants | Grenada | 0.0 /100 | #347 | Tragic 28.7% |
Demographics Similar to Hispanics or Latinos by 2 or more Vehicles in Household
In terms of 2 or more vehicles in household, the demographic groups most similar to Hispanics or Latinos are Immigrants from Germany (57.9%, a difference of 0.0%), Pakistani (57.9%, a difference of 0.030%), Shoshone (57.9%, a difference of 0.050%), Ottawa (57.9%, a difference of 0.060%), and Immigrants from Iran (57.9%, a difference of 0.070%).
| Demographics | Rating | Rank | 2 or more Vehicles in Household |
| Icelanders | 99.2 /100 | #83 | Exceptional 58.0% |
| Maltese | 99.2 /100 | #84 | Exceptional 58.0% |
| Slovaks | 99.2 /100 | #85 | Exceptional 58.0% |
| Potawatomi | 99.1 /100 | #86 | Exceptional 58.0% |
| Thais | 99.1 /100 | #87 | Exceptional 57.9% |
| Immigrants | Iran | 99.1 /100 | #88 | Exceptional 57.9% |
| Immigrants | Germany | 99.0 /100 | #89 | Exceptional 57.9% |
| Hispanics or Latinos | 99.0 /100 | #90 | Exceptional 57.9% |
| Pakistanis | 99.0 /100 | #91 | Exceptional 57.9% |
| Shoshone | 99.0 /100 | #92 | Exceptional 57.9% |
| Ottawa | 99.0 /100 | #93 | Exceptional 57.9% |
| Filipinos | 98.9 /100 | #94 | Exceptional 57.8% |
| Hmong | 98.9 /100 | #95 | Exceptional 57.8% |
| Burmese | 98.8 /100 | #96 | Exceptional 57.8% |
| Slavs | 98.8 /100 | #97 | Exceptional 57.8% |