Inupiat vs Hispanic or Latino 2 or more Vehicles in Household
COMPARE
Inupiat
Hispanic or Latino
2 or more Vehicles in Household
2 or more Vehicles in Household Comparison
Inupiat
Hispanics or Latinos
42.6%
2 OR MORE VEHICLES IN HOUSEHOLD
0.0/ 100
METRIC RATING
328th/ 347
METRIC RANK
57.9%
2 OR MORE VEHICLES IN HOUSEHOLD
99.0/ 100
METRIC RATING
90th/ 347
METRIC RANK
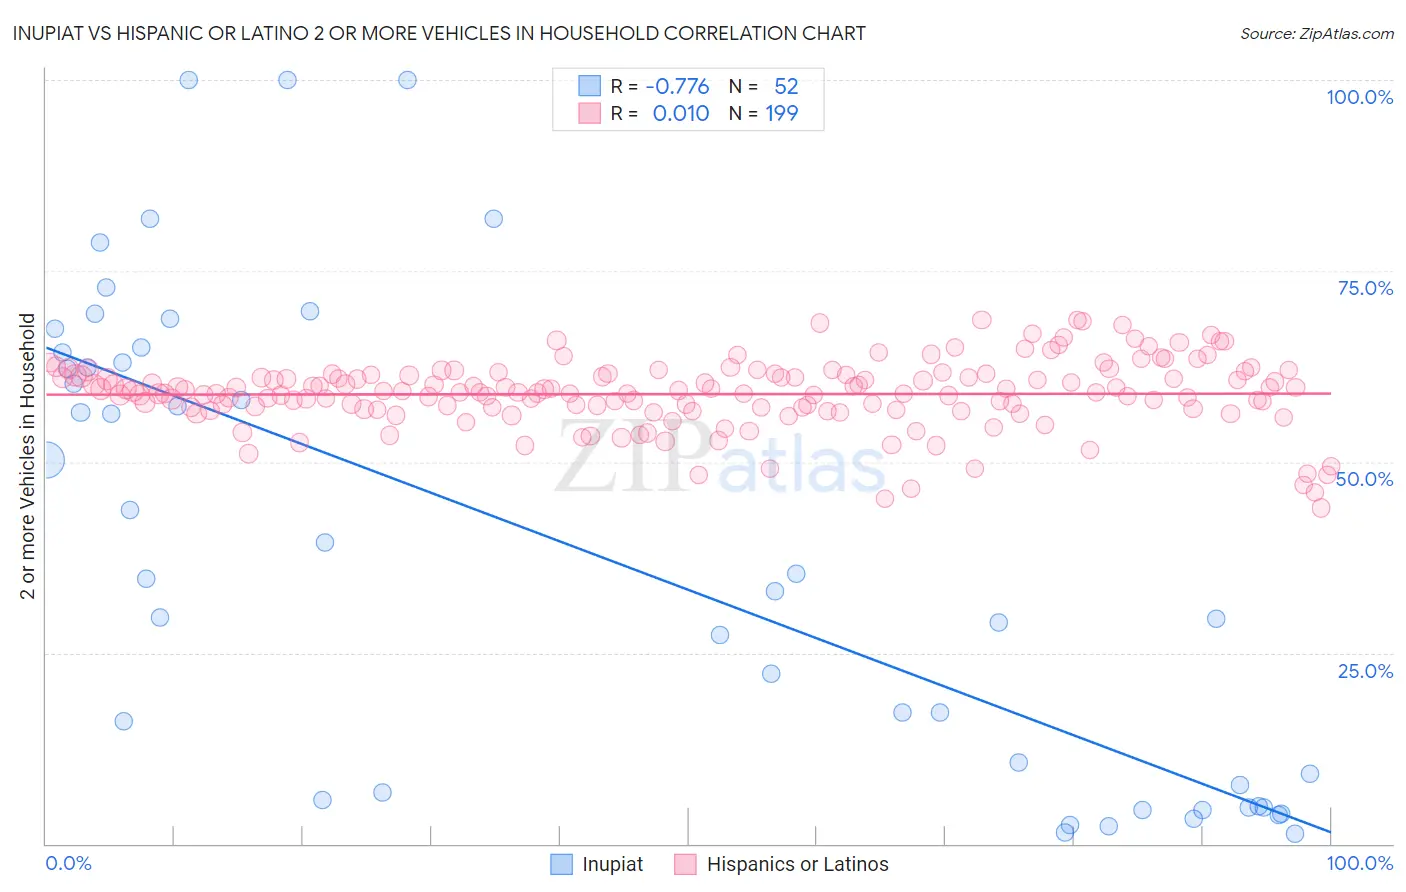
Inupiat vs Hispanic or Latino 2 or more Vehicles in Household Correlation Chart
The statistical analysis conducted on geographies consisting of 96,302,889 people shows a strong negative correlation between the proportion of Inupiat and percentage of households with 2 or more vehicles available in the United States with a correlation coefficient (R) of -0.776 and weighted average of 42.6%. Similarly, the statistical analysis conducted on geographies consisting of 560,775,190 people shows no correlation between the proportion of Hispanics or Latinos and percentage of households with 2 or more vehicles available in the United States with a correlation coefficient (R) of 0.010 and weighted average of 57.9%, a difference of 35.8%.
2 or more Vehicles in Household Correlation Summary
| Measurement | Inupiat | Hispanic or Latino |
| Minimum | 1.4% | 44.0% |
| Maximum | 100.0% | 68.6% |
| Range | 98.6% | 24.6% |
| Mean | 38.5% | 58.9% |
| Median | 33.9% | 59.1% |
| Interquartile 25% (IQ1) | 6.2% | 56.9% |
| Interquartile 75% (IQ3) | 63.7% | 61.4% |
| Interquartile Range (IQR) | 57.5% | 4.5% |
| Standard Deviation (Sample) | 30.7% | 4.5% |
| Standard Deviation (Population) | 30.4% | 4.5% |
Similar Demographics by 2 or more Vehicles in Household
Demographics Similar to Inupiat by 2 or more Vehicles in Household
In terms of 2 or more vehicles in household, the demographic groups most similar to Inupiat are Immigrants from Yemen (42.8%, a difference of 0.50%), Immigrants from Senegal (43.0%, a difference of 0.91%), Immigrants from West Indies (43.1%, a difference of 1.1%), Ecuadorian (42.0%, a difference of 1.6%), and Immigrants from Cabo Verde (43.3%, a difference of 1.6%).
| Demographics | Rating | Rank | 2 or more Vehicles in Household |
| Immigrants | Jamaica | 0.0 /100 | #321 | Tragic 44.5% |
| Senegalese | 0.0 /100 | #322 | Tragic 44.2% |
| Immigrants | Caribbean | 0.0 /100 | #323 | Tragic 44.2% |
| Immigrants | Cabo Verde | 0.0 /100 | #324 | Tragic 43.3% |
| Immigrants | West Indies | 0.0 /100 | #325 | Tragic 43.1% |
| Immigrants | Senegal | 0.0 /100 | #326 | Tragic 43.0% |
| Immigrants | Yemen | 0.0 /100 | #327 | Tragic 42.8% |
| Inupiat | 0.0 /100 | #328 | Tragic 42.6% |
| Ecuadorians | 0.0 /100 | #329 | Tragic 42.0% |
| Immigrants | Dominica | 0.0 /100 | #330 | Tragic 41.6% |
| West Indians | 0.0 /100 | #331 | Tragic 41.3% |
| Trinidadians and Tobagonians | 0.0 /100 | #332 | Tragic 40.9% |
| Immigrants | Ecuador | 0.0 /100 | #333 | Tragic 40.5% |
| Immigrants | Trinidad and Tobago | 0.0 /100 | #334 | Tragic 40.3% |
| Immigrants | Bangladesh | 0.0 /100 | #335 | Tragic 38.8% |
Demographics Similar to Hispanics or Latinos by 2 or more Vehicles in Household
In terms of 2 or more vehicles in household, the demographic groups most similar to Hispanics or Latinos are Immigrants from Germany (57.9%, a difference of 0.0%), Pakistani (57.9%, a difference of 0.030%), Shoshone (57.9%, a difference of 0.050%), Ottawa (57.9%, a difference of 0.060%), and Immigrants from Iran (57.9%, a difference of 0.070%).
| Demographics | Rating | Rank | 2 or more Vehicles in Household |
| Icelanders | 99.2 /100 | #83 | Exceptional 58.0% |
| Maltese | 99.2 /100 | #84 | Exceptional 58.0% |
| Slovaks | 99.2 /100 | #85 | Exceptional 58.0% |
| Potawatomi | 99.1 /100 | #86 | Exceptional 58.0% |
| Thais | 99.1 /100 | #87 | Exceptional 57.9% |
| Immigrants | Iran | 99.1 /100 | #88 | Exceptional 57.9% |
| Immigrants | Germany | 99.0 /100 | #89 | Exceptional 57.9% |
| Hispanics or Latinos | 99.0 /100 | #90 | Exceptional 57.9% |
| Pakistanis | 99.0 /100 | #91 | Exceptional 57.9% |
| Shoshone | 99.0 /100 | #92 | Exceptional 57.9% |
| Ottawa | 99.0 /100 | #93 | Exceptional 57.9% |
| Filipinos | 98.9 /100 | #94 | Exceptional 57.8% |
| Hmong | 98.9 /100 | #95 | Exceptional 57.8% |
| Burmese | 98.8 /100 | #96 | Exceptional 57.8% |
| Slavs | 98.8 /100 | #97 | Exceptional 57.8% |