Yakama vs Ghanaian 3 or more Vehicles in Household
COMPARE
Yakama
Ghanaian
3 or more Vehicles in Household
3 or more Vehicles in Household Comparison
Yakama
Ghanaians
31.0%
3 OR MORE VEHICLES IN HOUSEHOLD
100.0/ 100
METRIC RATING
1st/ 347
METRIC RANK
16.4%
3 OR MORE VEHICLES IN HOUSEHOLD
0.0/ 100
METRIC RATING
304th/ 347
METRIC RANK
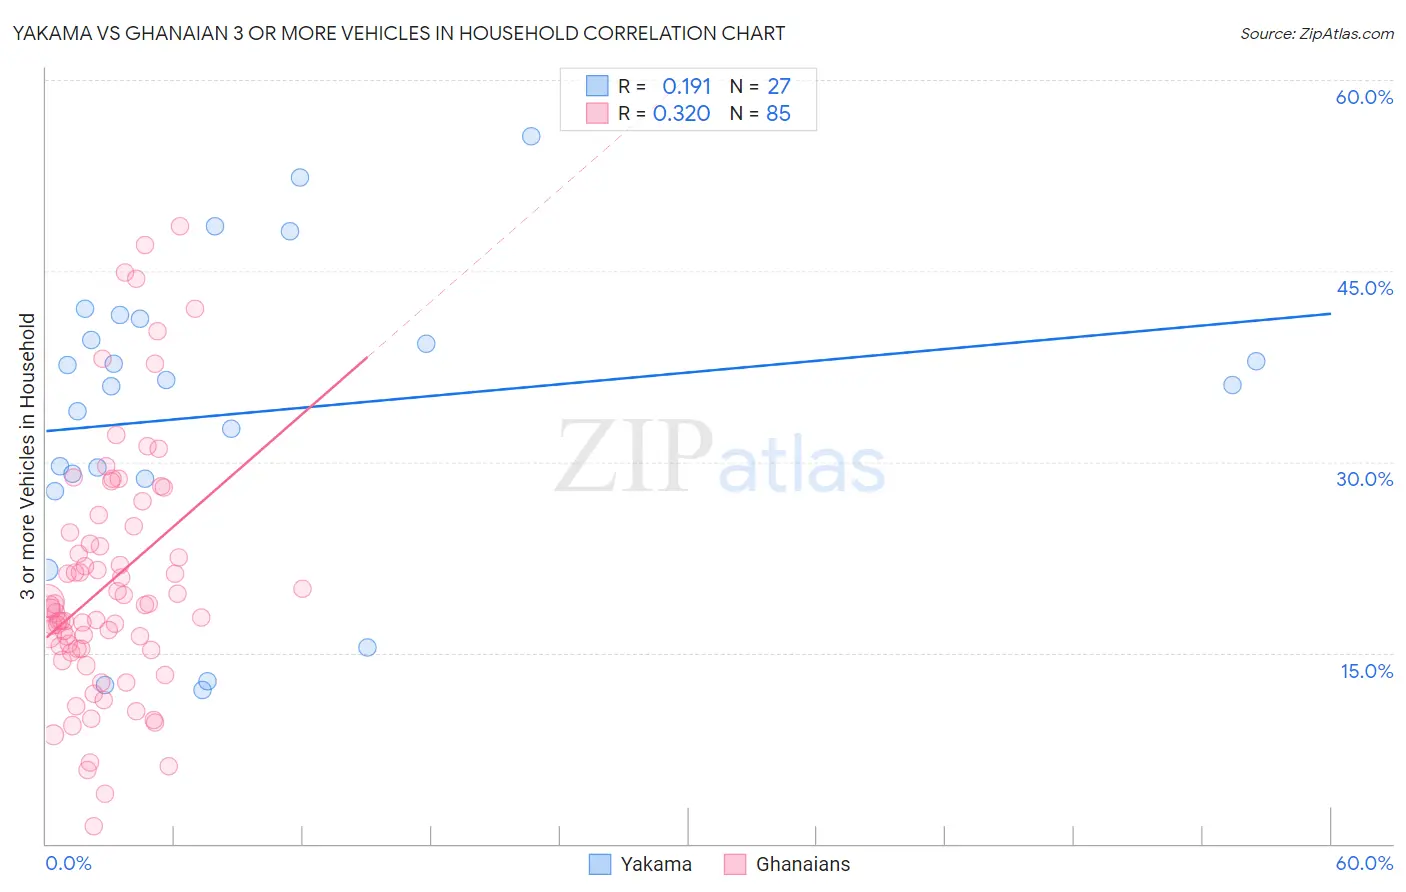
Yakama vs Ghanaian 3 or more Vehicles in Household Correlation Chart
The statistical analysis conducted on geographies consisting of 19,917,800 people shows a poor positive correlation between the proportion of Yakama and percentage of households with 3 or more vehicles available in the United States with a correlation coefficient (R) of 0.191 and weighted average of 31.0%. Similarly, the statistical analysis conducted on geographies consisting of 190,488,118 people shows a mild positive correlation between the proportion of Ghanaians and percentage of households with 3 or more vehicles available in the United States with a correlation coefficient (R) of 0.320 and weighted average of 16.4%, a difference of 89.4%.
3 or more Vehicles in Household Correlation Summary
| Measurement | Yakama | Ghanaian |
| Minimum | 12.1% | 1.4% |
| Maximum | 55.6% | 48.5% |
| Range | 43.5% | 47.1% |
| Mean | 33.9% | 20.5% |
| Median | 36.0% | 18.7% |
| Interquartile 25% (IQ1) | 28.7% | 15.3% |
| Interquartile 75% (IQ3) | 41.3% | 24.7% |
| Interquartile Range (IQR) | 12.6% | 9.4% |
| Standard Deviation (Sample) | 11.7% | 9.7% |
| Standard Deviation (Population) | 11.4% | 9.7% |
Similar Demographics by 3 or more Vehicles in Household
Demographics Similar to Yakama by 3 or more Vehicles in Household
In terms of 3 or more vehicles in household, the demographic groups most similar to Yakama are Spanish American Indian (26.9%, a difference of 15.0%), Tongan (26.5%, a difference of 16.8%), Arapaho (26.4%, a difference of 17.1%), Puget Sound Salish (26.4%, a difference of 17.5%), and Immigrants from Fiji (26.1%, a difference of 18.9%).
| Demographics | Rating | Rank | 3 or more Vehicles in Household |
| Yakama | 100.0 /100 | #1 | Exceptional 31.0% |
| Spanish American Indians | 100.0 /100 | #2 | Exceptional 26.9% |
| Tongans | 100.0 /100 | #3 | Exceptional 26.5% |
| Arapaho | 100.0 /100 | #4 | Exceptional 26.4% |
| Puget Sound Salish | 100.0 /100 | #5 | Exceptional 26.4% |
| Immigrants | Fiji | 100.0 /100 | #6 | Exceptional 26.1% |
| Colville | 100.0 /100 | #7 | Exceptional 25.8% |
| Samoans | 100.0 /100 | #8 | Exceptional 25.0% |
| Native Hawaiians | 100.0 /100 | #9 | Exceptional 24.9% |
| Nepalese | 100.0 /100 | #10 | Exceptional 24.9% |
| Shoshone | 100.0 /100 | #11 | Exceptional 24.9% |
| Danes | 100.0 /100 | #12 | Exceptional 24.7% |
| Mexicans | 100.0 /100 | #13 | Exceptional 24.7% |
| Immigrants | Mexico | 100.0 /100 | #14 | Exceptional 24.6% |
| Hawaiians | 100.0 /100 | #15 | Exceptional 24.3% |
Demographics Similar to Ghanaians by 3 or more Vehicles in Household
In terms of 3 or more vehicles in household, the demographic groups most similar to Ghanaians are Immigrants from Morocco (16.3%, a difference of 0.26%), Immigrants from Serbia (16.4%, a difference of 0.47%), Immigrants from Greece (16.5%, a difference of 0.78%), Somali (16.2%, a difference of 1.1%), and Paraguayan (16.6%, a difference of 1.2%).
| Demographics | Rating | Rank | 3 or more Vehicles in Household |
| Israelis | 0.1 /100 | #297 | Tragic 16.8% |
| Immigrants | Zaire | 0.1 /100 | #298 | Tragic 16.7% |
| Immigrants | South America | 0.1 /100 | #299 | Tragic 16.7% |
| Cypriots | 0.0 /100 | #300 | Tragic 16.6% |
| Paraguayans | 0.0 /100 | #301 | Tragic 16.6% |
| Immigrants | Greece | 0.0 /100 | #302 | Tragic 16.5% |
| Immigrants | Serbia | 0.0 /100 | #303 | Tragic 16.4% |
| Ghanaians | 0.0 /100 | #304 | Tragic 16.4% |
| Immigrants | Morocco | 0.0 /100 | #305 | Tragic 16.3% |
| Somalis | 0.0 /100 | #306 | Tragic 16.2% |
| Immigrants | Ghana | 0.0 /100 | #307 | Tragic 16.2% |
| Houma | 0.0 /100 | #308 | Tragic 16.1% |
| Immigrants | Somalia | 0.0 /100 | #309 | Tragic 15.9% |
| Moroccans | 0.0 /100 | #310 | Tragic 15.9% |
| Albanians | 0.0 /100 | #311 | Tragic 15.8% |