Yakama vs Immigrants from Hungary Doctorate Degree
COMPARE
Yakama
Immigrants from Hungary
Doctorate Degree
Doctorate Degree Comparison
Yakama
Immigrants from Hungary
1.3%
DOCTORATE DEGREE
0.0/ 100
METRIC RATING
332nd/ 347
METRIC RANK
2.2%
DOCTORATE DEGREE
99.8/ 100
METRIC RATING
76th/ 347
METRIC RANK
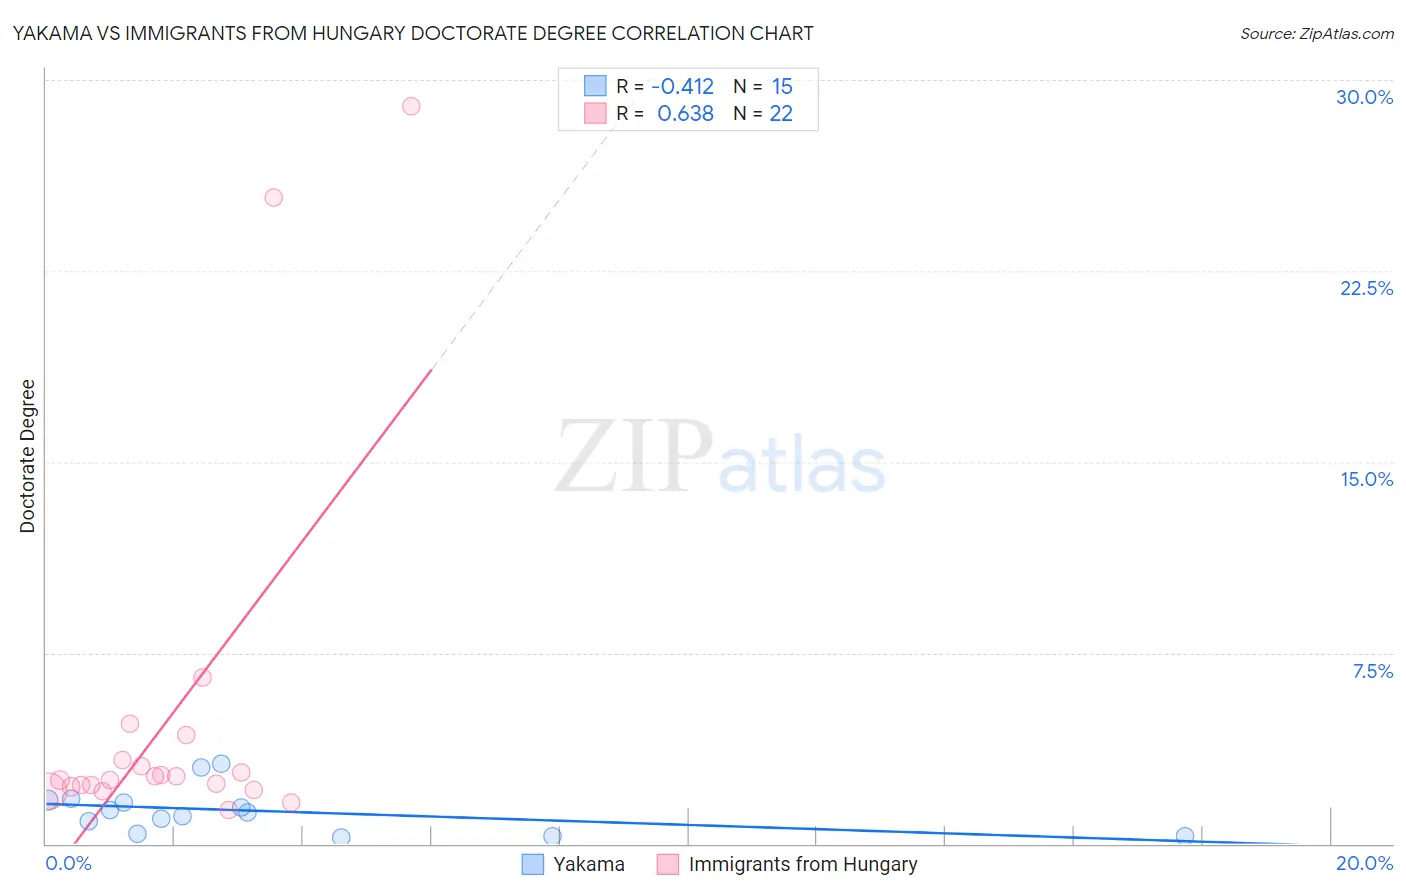
Yakama vs Immigrants from Hungary Doctorate Degree Correlation Chart
The statistical analysis conducted on geographies consisting of 19,742,770 people shows a moderate negative correlation between the proportion of Yakama and percentage of population with at least doctorate degree education in the United States with a correlation coefficient (R) of -0.412 and weighted average of 1.3%. Similarly, the statistical analysis conducted on geographies consisting of 195,058,211 people shows a significant positive correlation between the proportion of Immigrants from Hungary and percentage of population with at least doctorate degree education in the United States with a correlation coefficient (R) of 0.638 and weighted average of 2.2%, a difference of 75.0%.
Doctorate Degree Correlation Summary
| Measurement | Yakama | Immigrants from Hungary |
| Minimum | 0.27% | 1.3% |
| Maximum | 3.1% | 29.0% |
| Range | 2.9% | 27.7% |
| Mean | 1.3% | 5.0% |
| Median | 1.2% | 2.6% |
| Interquartile 25% (IQ1) | 0.37% | 2.2% |
| Interquartile 75% (IQ3) | 1.7% | 3.3% |
| Interquartile Range (IQR) | 1.3% | 1.1% |
| Standard Deviation (Sample) | 0.89% | 7.3% |
| Standard Deviation (Population) | 0.86% | 7.1% |
Similar Demographics by Doctorate Degree
Demographics Similar to Yakama by Doctorate Degree
In terms of doctorate degree, the demographic groups most similar to Yakama are Immigrants from Caribbean (1.3%, a difference of 0.16%), Immigrants from Dominican Republic (1.3%, a difference of 0.35%), Immigrants from Latin America (1.3%, a difference of 1.6%), Yup'ik (1.3%, a difference of 1.6%), and Haitian (1.3%, a difference of 1.8%).
| Demographics | Rating | Rank | Doctorate Degree |
| Pima | 0.0 /100 | #325 | Tragic 1.3% |
| Immigrants | Cabo Verde | 0.0 /100 | #326 | Tragic 1.3% |
| Hispanics or Latinos | 0.0 /100 | #327 | Tragic 1.3% |
| Inupiat | 0.0 /100 | #328 | Tragic 1.3% |
| Haitians | 0.0 /100 | #329 | Tragic 1.3% |
| Yup'ik | 0.0 /100 | #330 | Tragic 1.3% |
| Immigrants | Latin America | 0.0 /100 | #331 | Tragic 1.3% |
| Yakama | 0.0 /100 | #332 | Tragic 1.3% |
| Immigrants | Caribbean | 0.0 /100 | #333 | Tragic 1.3% |
| Immigrants | Dominican Republic | 0.0 /100 | #334 | Tragic 1.3% |
| Immigrants | Haiti | 0.0 /100 | #335 | Tragic 1.3% |
| Nepalese | 0.0 /100 | #336 | Tragic 1.3% |
| Bangladeshis | 0.0 /100 | #337 | Tragic 1.2% |
| Puget Sound Salish | 0.0 /100 | #338 | Tragic 1.2% |
| Immigrants | Central America | 0.0 /100 | #339 | Tragic 1.2% |
Demographics Similar to Immigrants from Hungary by Doctorate Degree
In terms of doctorate degree, the demographic groups most similar to Immigrants from Hungary are Immigrants from Lebanon (2.2%, a difference of 0.010%), Immigrants from Western Asia (2.2%, a difference of 0.070%), Immigrants from North America (2.2%, a difference of 0.18%), Immigrants from Bulgaria (2.3%, a difference of 0.31%), and Immigrants from Canada (2.3%, a difference of 0.40%).
| Demographics | Rating | Rank | Doctorate Degree |
| Carpatho Rusyns | 99.8 /100 | #69 | Exceptional 2.3% |
| Lithuanians | 99.8 /100 | #70 | Exceptional 2.3% |
| Immigrants | Bolivia | 99.8 /100 | #71 | Exceptional 2.3% |
| Immigrants | Canada | 99.8 /100 | #72 | Exceptional 2.3% |
| Immigrants | Bulgaria | 99.8 /100 | #73 | Exceptional 2.3% |
| Immigrants | North America | 99.8 /100 | #74 | Exceptional 2.2% |
| Immigrants | Western Asia | 99.8 /100 | #75 | Exceptional 2.2% |
| Immigrants | Hungary | 99.8 /100 | #76 | Exceptional 2.2% |
| Immigrants | Lebanon | 99.8 /100 | #77 | Exceptional 2.2% |
| Immigrants | Belarus | 99.7 /100 | #78 | Exceptional 2.2% |
| Northern Europeans | 99.7 /100 | #79 | Exceptional 2.2% |
| Ugandans | 99.7 /100 | #80 | Exceptional 2.2% |
| Immigrants | Argentina | 99.7 /100 | #81 | Exceptional 2.2% |
| Immigrants | Uganda | 99.6 /100 | #82 | Exceptional 2.2% |
| Immigrants | Lithuania | 99.6 /100 | #83 | Exceptional 2.2% |