West Indian vs New Zealander No Vehicles in Household
COMPARE
West Indian
New Zealander
No Vehicles in Household
No Vehicles in Household Comparison
West Indians
New Zealanders
23.7%
NO VEHICLES IN HOUSEHOLD
0.0/ 100
METRIC RATING
330th/ 347
METRIC RANK
10.2%
NO VEHICLES IN HOUSEHOLD
65.1/ 100
METRIC RATING
161st/ 347
METRIC RANK
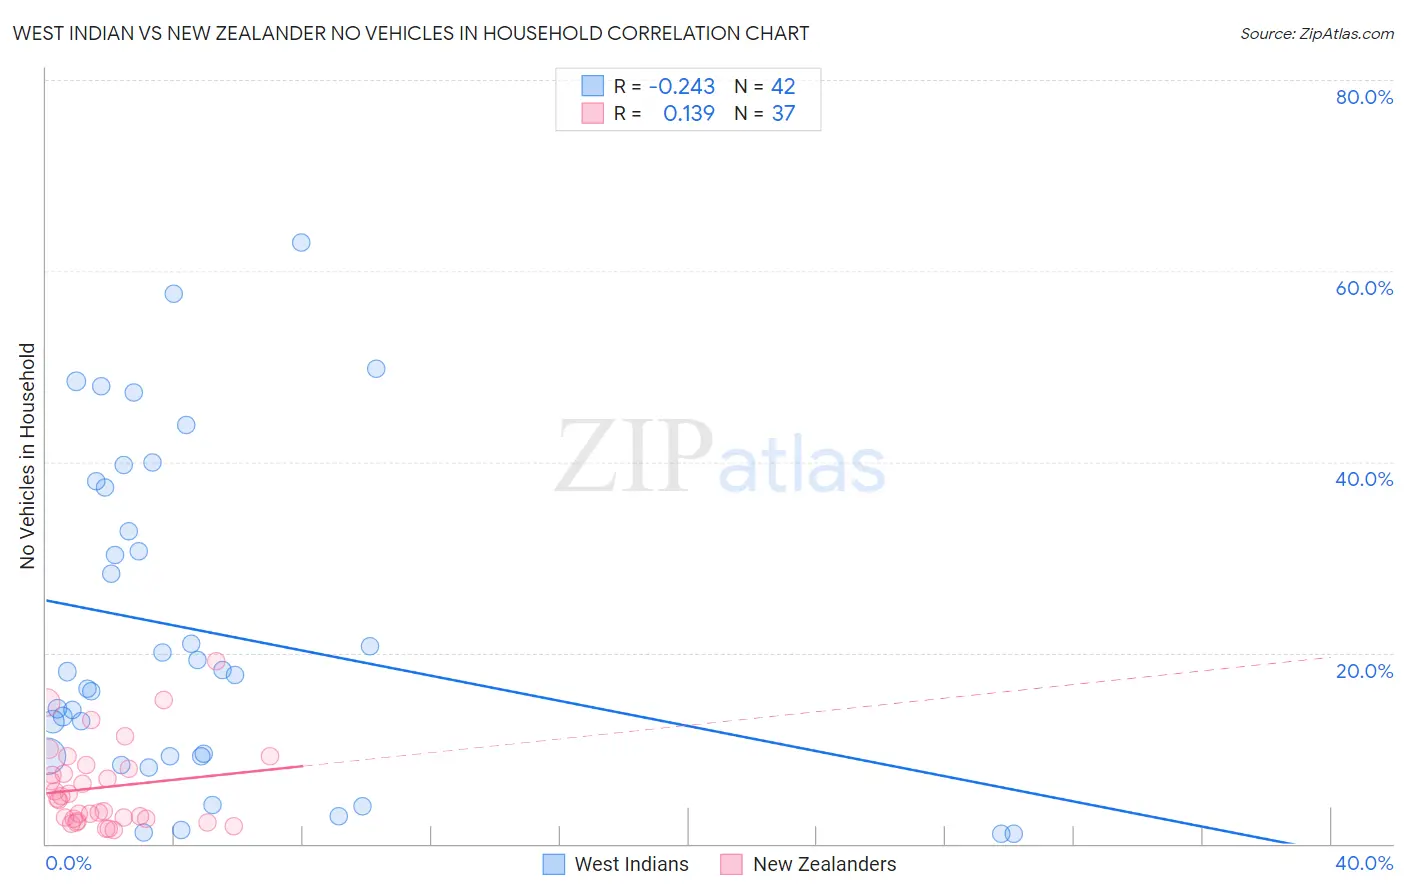
West Indian vs New Zealander No Vehicles in Household Correlation Chart
The statistical analysis conducted on geographies consisting of 253,703,061 people shows a weak negative correlation between the proportion of West Indians and percentage of households with no vehicle available in the United States with a correlation coefficient (R) of -0.243 and weighted average of 23.7%. Similarly, the statistical analysis conducted on geographies consisting of 106,783,580 people shows a poor positive correlation between the proportion of New Zealanders and percentage of households with no vehicle available in the United States with a correlation coefficient (R) of 0.139 and weighted average of 10.2%, a difference of 132.8%.
No Vehicles in Household Correlation Summary
| Measurement | West Indian | New Zealander |
| Minimum | 1.0% | 1.5% |
| Maximum | 63.0% | 19.1% |
| Range | 62.0% | 17.7% |
| Mean | 22.3% | 5.9% |
| Median | 17.9% | 4.7% |
| Interquartile 25% (IQ1) | 9.2% | 2.6% |
| Interquartile 75% (IQ3) | 37.3% | 8.1% |
| Interquartile Range (IQR) | 28.1% | 5.4% |
| Standard Deviation (Sample) | 17.0% | 4.3% |
| Standard Deviation (Population) | 16.8% | 4.3% |
Similar Demographics by No Vehicles in Household
Demographics Similar to West Indians by No Vehicles in Household
In terms of no vehicles in household, the demographic groups most similar to West Indians are Trinidadian and Tobagonian (23.7%, a difference of 0.18%), Immigrants from Ecuador (23.8%, a difference of 0.51%), Immigrants from Trinidad and Tobago (24.6%, a difference of 3.9%), Ecuadorian (22.8%, a difference of 4.2%), and Immigrants from Dominica (22.2%, a difference of 6.6%).
| Demographics | Rating | Rank | No Vehicles in Household |
| Immigrants | Yemen | 0.0 /100 | #323 | Tragic 19.5% |
| Immigrants | Caribbean | 0.0 /100 | #324 | Tragic 19.6% |
| Senegalese | 0.0 /100 | #325 | Tragic 19.8% |
| Immigrants | West Indies | 0.0 /100 | #326 | Tragic 20.5% |
| Immigrants | Senegal | 0.0 /100 | #327 | Tragic 21.1% |
| Immigrants | Dominica | 0.0 /100 | #328 | Tragic 22.2% |
| Ecuadorians | 0.0 /100 | #329 | Tragic 22.8% |
| West Indians | 0.0 /100 | #330 | Tragic 23.7% |
| Trinidadians and Tobagonians | 0.0 /100 | #331 | Tragic 23.7% |
| Immigrants | Ecuador | 0.0 /100 | #332 | Tragic 23.8% |
| Immigrants | Trinidad and Tobago | 0.0 /100 | #333 | Tragic 24.6% |
| Immigrants | Bangladesh | 0.0 /100 | #334 | Tragic 25.8% |
| Barbadians | 0.0 /100 | #335 | Tragic 26.1% |
| Vietnamese | 0.0 /100 | #336 | Tragic 26.2% |
| Immigrants | Uzbekistan | 0.0 /100 | #337 | Tragic 26.7% |
Demographics Similar to New Zealanders by No Vehicles in Household
In terms of no vehicles in household, the demographic groups most similar to New Zealanders are Immigrants from Middle Africa (10.2%, a difference of 0.10%), Immigrants from Austria (10.2%, a difference of 0.10%), Immigrants from Cambodia (10.2%, a difference of 0.21%), South African (10.2%, a difference of 0.58%), and Comanche (10.2%, a difference of 0.63%).
| Demographics | Rating | Rank | No Vehicles in Household |
| Sioux | 72.4 /100 | #154 | Good 10.1% |
| Salvadorans | 72.4 /100 | #155 | Good 10.1% |
| Immigrants | Micronesia | 70.9 /100 | #156 | Good 10.1% |
| Australians | 70.6 /100 | #157 | Good 10.1% |
| Spanish American Indians | 70.2 /100 | #158 | Good 10.1% |
| Immigrants | Indonesia | 69.3 /100 | #159 | Good 10.1% |
| Immigrants | Middle Africa | 65.7 /100 | #160 | Good 10.2% |
| New Zealanders | 65.1 /100 | #161 | Good 10.2% |
| Immigrants | Austria | 64.4 /100 | #162 | Good 10.2% |
| Immigrants | Cambodia | 63.7 /100 | #163 | Good 10.2% |
| South Africans | 61.1 /100 | #164 | Good 10.2% |
| Comanche | 60.8 /100 | #165 | Good 10.2% |
| Immigrants | Costa Rica | 60.5 /100 | #166 | Good 10.3% |
| Immigrants | Saudi Arabia | 58.8 /100 | #167 | Average 10.3% |
| Indonesians | 56.7 /100 | #168 | Average 10.3% |