West Indian vs New Zealander Householder Income Ages 45 - 64 years
COMPARE
West Indian
New Zealander
Householder Income Ages 45 - 64 years
Householder Income Ages 45 - 64 years Comparison
West Indians
New Zealanders
$89,906
HOUSEHOLDER INCOME AGES 45 - 64 YEARS
0.5/ 100
METRIC RATING
255th/ 347
METRIC RANK
$111,286
HOUSEHOLDER INCOME AGES 45 - 64 YEARS
99.6/ 100
METRIC RATING
66th/ 347
METRIC RANK
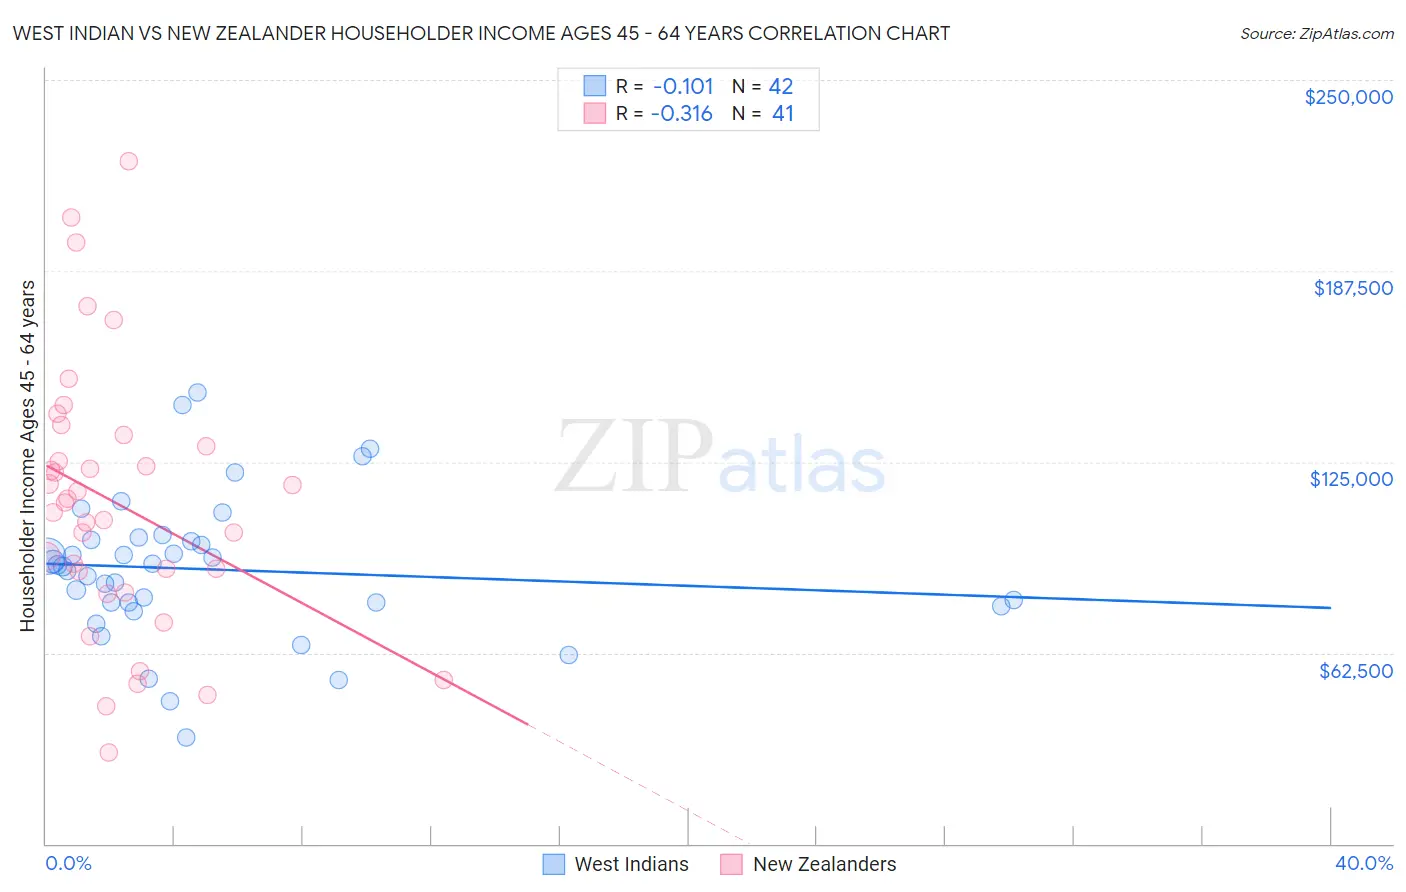
West Indian vs New Zealander Householder Income Ages 45 - 64 years Correlation Chart
The statistical analysis conducted on geographies consisting of 253,646,357 people shows a poor negative correlation between the proportion of West Indians and household income with householder between the ages 45 and 64 in the United States with a correlation coefficient (R) of -0.101 and weighted average of $89,906. Similarly, the statistical analysis conducted on geographies consisting of 106,839,275 people shows a mild negative correlation between the proportion of New Zealanders and household income with householder between the ages 45 and 64 in the United States with a correlation coefficient (R) of -0.316 and weighted average of $111,286, a difference of 23.8%.
Householder Income Ages 45 - 64 years Correlation Summary
| Measurement | West Indian | New Zealander |
| Minimum | $34,699 | $29,688 |
| Maximum | $147,760 | $223,409 |
| Range | $113,061 | $193,721 |
| Mean | $89,808 | $111,423 |
| Median | $91,034 | $111,501 |
| Interquartile 25% (IQ1) | $78,920 | $85,594 |
| Interquartile 75% (IQ3) | $99,241 | $131,875 |
| Interquartile Range (IQR) | $20,321 | $46,281 |
| Standard Deviation (Sample) | $23,506 | $43,171 |
| Standard Deviation (Population) | $23,224 | $42,642 |
Similar Demographics by Householder Income Ages 45 - 64 years
Demographics Similar to West Indians by Householder Income Ages 45 - 64 years
In terms of householder income ages 45 - 64 years, the demographic groups most similar to West Indians are French American Indian ($89,811, a difference of 0.11%), Immigrants from Guyana ($90,186, a difference of 0.31%), Barbadian ($90,266, a difference of 0.40%), German Russian ($89,398, a difference of 0.57%), and Immigrants from Barbados ($89,394, a difference of 0.57%).
| Demographics | Rating | Rank | Householder Income Ages 45 - 64 years |
| Immigrants | Laos | 0.9 /100 | #248 | Tragic $90,909 |
| Mexican American Indians | 0.8 /100 | #249 | Tragic $90,811 |
| Sub-Saharan Africans | 0.8 /100 | #250 | Tragic $90,691 |
| Americans | 0.7 /100 | #251 | Tragic $90,536 |
| Marshallese | 0.7 /100 | #252 | Tragic $90,455 |
| Barbadians | 0.6 /100 | #253 | Tragic $90,266 |
| Immigrants | Guyana | 0.6 /100 | #254 | Tragic $90,186 |
| West Indians | 0.5 /100 | #255 | Tragic $89,906 |
| French American Indians | 0.5 /100 | #256 | Tragic $89,811 |
| German Russians | 0.4 /100 | #257 | Tragic $89,398 |
| Immigrants | Barbados | 0.4 /100 | #258 | Tragic $89,394 |
| Immigrants | Nicaragua | 0.4 /100 | #259 | Tragic $89,108 |
| Liberians | 0.3 /100 | #260 | Tragic $88,929 |
| Belizeans | 0.3 /100 | #261 | Tragic $88,684 |
| Somalis | 0.3 /100 | #262 | Tragic $88,600 |
Demographics Similar to New Zealanders by Householder Income Ages 45 - 64 years
In terms of householder income ages 45 - 64 years, the demographic groups most similar to New Zealanders are Immigrants from Belarus ($111,430, a difference of 0.13%), Immigrants from Latvia ($111,454, a difference of 0.15%), Laotian ($111,051, a difference of 0.21%), Mongolian ($111,602, a difference of 0.28%), and Immigrants from Norway ($111,669, a difference of 0.34%).
| Demographics | Rating | Rank | Householder Income Ages 45 - 64 years |
| Immigrants | Europe | 99.7 /100 | #59 | Exceptional $111,984 |
| Immigrants | Netherlands | 99.7 /100 | #60 | Exceptional $111,982 |
| Immigrants | Czechoslovakia | 99.7 /100 | #61 | Exceptional $111,914 |
| Immigrants | Norway | 99.7 /100 | #62 | Exceptional $111,669 |
| Mongolians | 99.6 /100 | #63 | Exceptional $111,602 |
| Immigrants | Latvia | 99.6 /100 | #64 | Exceptional $111,454 |
| Immigrants | Belarus | 99.6 /100 | #65 | Exceptional $111,430 |
| New Zealanders | 99.6 /100 | #66 | Exceptional $111,286 |
| Laotians | 99.5 /100 | #67 | Exceptional $111,051 |
| Immigrants | Romania | 99.4 /100 | #68 | Exceptional $110,633 |
| Immigrants | Italy | 99.4 /100 | #69 | Exceptional $110,434 |
| Koreans | 99.3 /100 | #70 | Exceptional $110,334 |
| Italians | 99.3 /100 | #71 | Exceptional $110,224 |
| Assyrians/Chaldeans/Syriacs | 99.3 /100 | #72 | Exceptional $110,201 |
| Argentineans | 99.3 /100 | #73 | Exceptional $110,103 |