West Indian vs Cypriot No Vehicles in Household
COMPARE
West Indian
Cypriot
No Vehicles in Household
No Vehicles in Household Comparison
West Indians
Cypriots
23.7%
NO VEHICLES IN HOUSEHOLD
0.0/ 100
METRIC RATING
330th/ 347
METRIC RANK
15.7%
NO VEHICLES IN HOUSEHOLD
0.0/ 100
METRIC RATING
315th/ 347
METRIC RANK
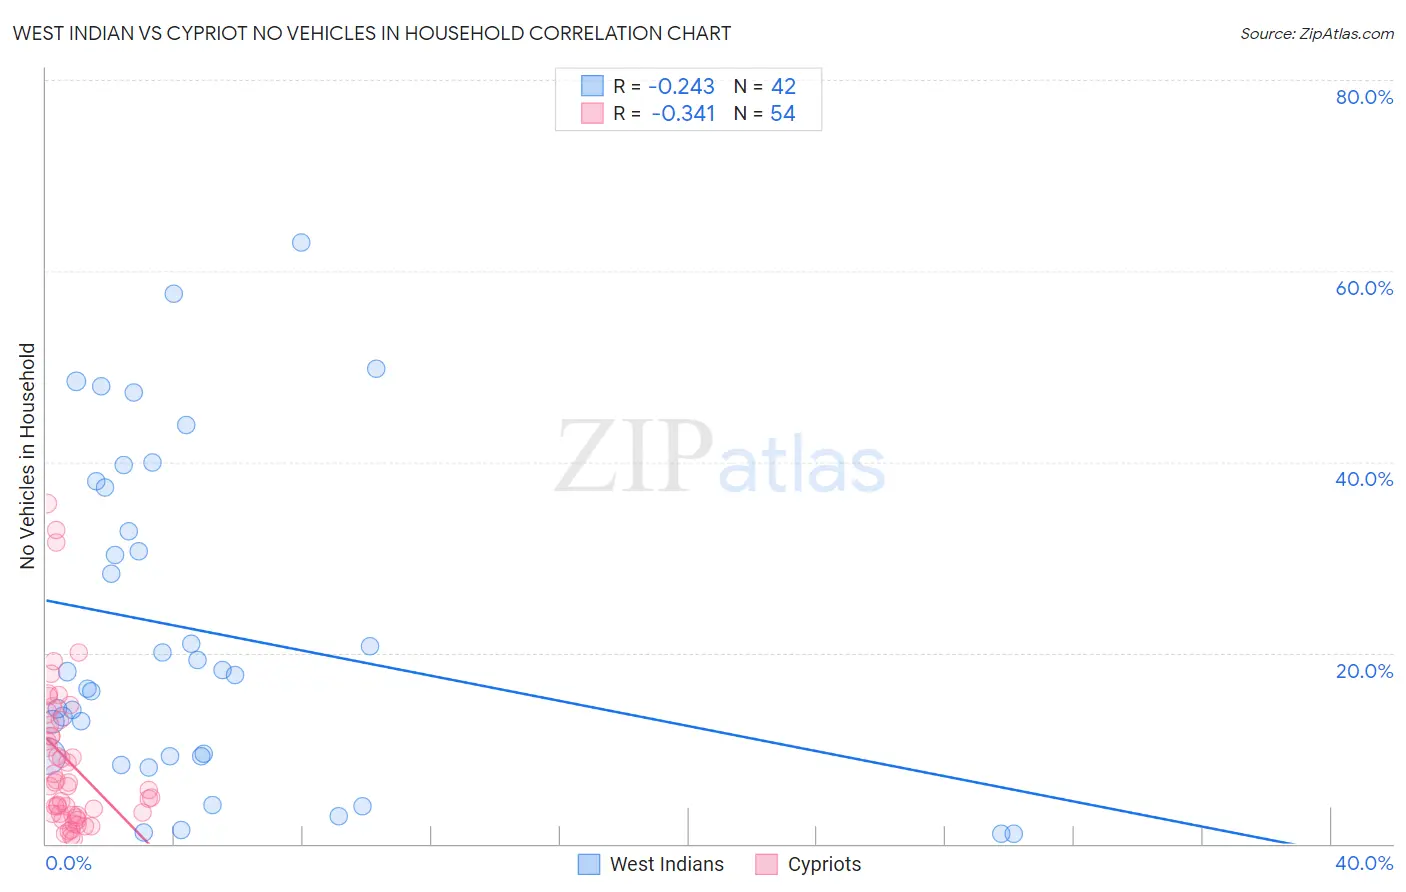
West Indian vs Cypriot No Vehicles in Household Correlation Chart
The statistical analysis conducted on geographies consisting of 253,703,061 people shows a weak negative correlation between the proportion of West Indians and percentage of households with no vehicle available in the United States with a correlation coefficient (R) of -0.243 and weighted average of 23.7%. Similarly, the statistical analysis conducted on geographies consisting of 61,831,419 people shows a mild negative correlation between the proportion of Cypriots and percentage of households with no vehicle available in the United States with a correlation coefficient (R) of -0.341 and weighted average of 15.7%, a difference of 51.3%.
No Vehicles in Household Correlation Summary
| Measurement | West Indian | Cypriot |
| Minimum | 1.0% | 0.54% |
| Maximum | 63.0% | 35.7% |
| Range | 62.0% | 35.1% |
| Mean | 22.3% | 8.6% |
| Median | 17.9% | 6.0% |
| Interquartile 25% (IQ1) | 9.2% | 3.0% |
| Interquartile 75% (IQ3) | 37.3% | 12.4% |
| Interquartile Range (IQR) | 28.1% | 9.4% |
| Standard Deviation (Sample) | 17.0% | 8.0% |
| Standard Deviation (Population) | 16.8% | 7.9% |
Demographics Similar to West Indians and Cypriots by No Vehicles in Household
In terms of no vehicles in household, the demographic groups most similar to West Indians are Trinidadian and Tobagonian (23.7%, a difference of 0.18%), Immigrants from Ecuador (23.8%, a difference of 0.51%), Ecuadorian (22.8%, a difference of 4.2%), Immigrants from Dominica (22.2%, a difference of 6.6%), and Immigrants from Senegal (21.1%, a difference of 12.1%). Similarly, the demographic groups most similar to Cypriots are Albanian (15.6%, a difference of 0.13%), Tohono O'odham (15.6%, a difference of 0.29%), Alaskan Athabascan (15.6%, a difference of 0.44%), Ghanaian (16.4%, a difference of 5.0%), and Immigrants from Ghana (16.6%, a difference of 6.0%).
| Demographics | Rating | Rank | No Vehicles in Household |
| Alaskan Athabascans | 0.0 /100 | #312 | Tragic 15.6% |
| Tohono O'odham | 0.0 /100 | #313 | Tragic 15.6% |
| Albanians | 0.0 /100 | #314 | Tragic 15.6% |
| Cypriots | 0.0 /100 | #315 | Tragic 15.7% |
| Ghanaians | 0.0 /100 | #316 | Tragic 16.4% |
| Immigrants | Ghana | 0.0 /100 | #317 | Tragic 16.6% |
| Immigrants | Belarus | 0.0 /100 | #318 | Tragic 16.7% |
| Alaska Natives | 0.0 /100 | #319 | Tragic 17.4% |
| Soviet Union | 0.0 /100 | #320 | Tragic 17.4% |
| Jamaicans | 0.0 /100 | #321 | Tragic 17.9% |
| Immigrants | Cabo Verde | 0.0 /100 | #322 | Tragic 18.4% |
| Immigrants | Yemen | 0.0 /100 | #323 | Tragic 19.5% |
| Immigrants | Caribbean | 0.0 /100 | #324 | Tragic 19.6% |
| Senegalese | 0.0 /100 | #325 | Tragic 19.8% |
| Immigrants | West Indies | 0.0 /100 | #326 | Tragic 20.5% |
| Immigrants | Senegal | 0.0 /100 | #327 | Tragic 21.1% |
| Immigrants | Dominica | 0.0 /100 | #328 | Tragic 22.2% |
| Ecuadorians | 0.0 /100 | #329 | Tragic 22.8% |
| West Indians | 0.0 /100 | #330 | Tragic 23.7% |
| Trinidadians and Tobagonians | 0.0 /100 | #331 | Tragic 23.7% |
| Immigrants | Ecuador | 0.0 /100 | #332 | Tragic 23.8% |