Iroquois vs New Zealander No Vehicles in Household
COMPARE
Iroquois
New Zealander
No Vehicles in Household
No Vehicles in Household Comparison
Iroquois
New Zealanders
10.9%
NO VEHICLES IN HOUSEHOLD
17.6/ 100
METRIC RATING
203rd/ 347
METRIC RANK
10.2%
NO VEHICLES IN HOUSEHOLD
65.1/ 100
METRIC RATING
161st/ 347
METRIC RANK
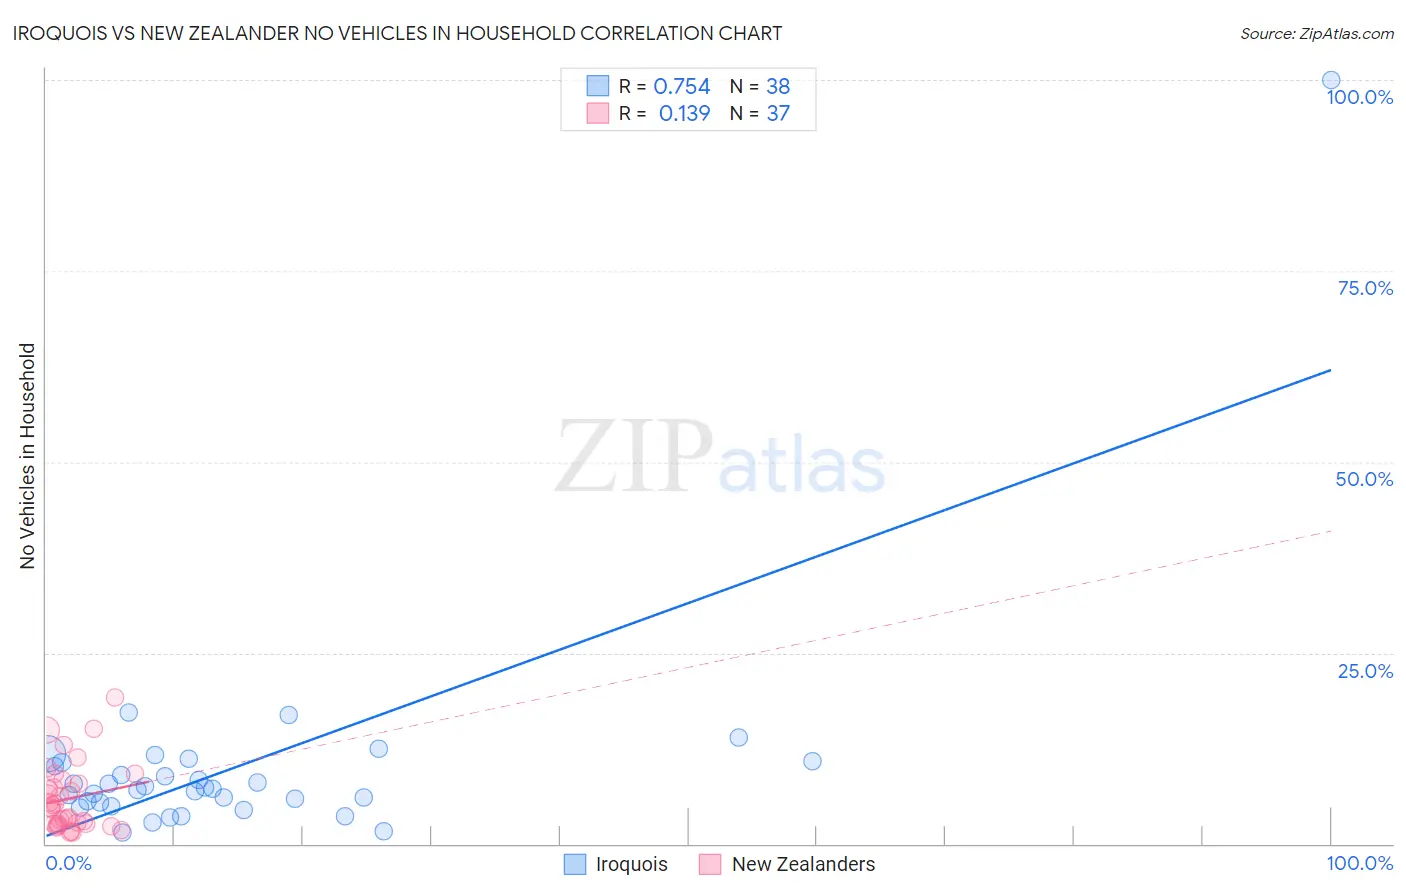
Iroquois vs New Zealander No Vehicles in Household Correlation Chart
The statistical analysis conducted on geographies consisting of 206,994,531 people shows a strong positive correlation between the proportion of Iroquois and percentage of households with no vehicle available in the United States with a correlation coefficient (R) of 0.754 and weighted average of 10.9%. Similarly, the statistical analysis conducted on geographies consisting of 106,783,580 people shows a poor positive correlation between the proportion of New Zealanders and percentage of households with no vehicle available in the United States with a correlation coefficient (R) of 0.139 and weighted average of 10.2%, a difference of 7.5%.
No Vehicles in Household Correlation Summary
| Measurement | Iroquois | New Zealander |
| Minimum | 1.5% | 1.5% |
| Maximum | 100.0% | 19.1% |
| Range | 98.5% | 17.7% |
| Mean | 10.1% | 5.9% |
| Median | 7.3% | 4.7% |
| Interquartile 25% (IQ1) | 5.5% | 2.6% |
| Interquartile 75% (IQ3) | 10.7% | 8.1% |
| Interquartile Range (IQR) | 5.2% | 5.4% |
| Standard Deviation (Sample) | 15.4% | 4.3% |
| Standard Deviation (Population) | 15.2% | 4.3% |
Similar Demographics by No Vehicles in Household
Demographics Similar to Iroquois by No Vehicles in Household
In terms of no vehicles in household, the demographic groups most similar to Iroquois are Romanian (10.9%, a difference of 0.070%), Immigrants from Western Europe (10.9%, a difference of 0.34%), Guatemalan (11.0%, a difference of 0.34%), Immigrants from Chile (11.0%, a difference of 0.38%), and Somali (11.0%, a difference of 0.39%).
| Demographics | Rating | Rank | No Vehicles in Household |
| Central Americans | 24.3 /100 | #196 | Fair 10.8% |
| Shoshone | 24.1 /100 | #197 | Fair 10.8% |
| Immigrants | Sweden | 22.9 /100 | #198 | Fair 10.8% |
| Immigrants | Asia | 21.3 /100 | #199 | Fair 10.9% |
| Cambodians | 19.6 /100 | #200 | Poor 10.9% |
| Immigrants | Western Europe | 19.1 /100 | #201 | Poor 10.9% |
| Romanians | 17.9 /100 | #202 | Poor 10.9% |
| Iroquois | 17.6 /100 | #203 | Poor 10.9% |
| Guatemalans | 16.1 /100 | #204 | Poor 11.0% |
| Immigrants | Chile | 15.9 /100 | #205 | Poor 11.0% |
| Somalis | 15.9 /100 | #206 | Poor 11.0% |
| Sierra Leoneans | 15.7 /100 | #207 | Poor 11.0% |
| Immigrants | Italy | 15.6 /100 | #208 | Poor 11.0% |
| Pennsylvania Germans | 15.5 /100 | #209 | Poor 11.0% |
| Apache | 14.8 /100 | #210 | Poor 11.0% |
Demographics Similar to New Zealanders by No Vehicles in Household
In terms of no vehicles in household, the demographic groups most similar to New Zealanders are Immigrants from Middle Africa (10.2%, a difference of 0.10%), Immigrants from Austria (10.2%, a difference of 0.10%), Immigrants from Cambodia (10.2%, a difference of 0.21%), South African (10.2%, a difference of 0.58%), and Comanche (10.2%, a difference of 0.63%).
| Demographics | Rating | Rank | No Vehicles in Household |
| Sioux | 72.4 /100 | #154 | Good 10.1% |
| Salvadorans | 72.4 /100 | #155 | Good 10.1% |
| Immigrants | Micronesia | 70.9 /100 | #156 | Good 10.1% |
| Australians | 70.6 /100 | #157 | Good 10.1% |
| Spanish American Indians | 70.2 /100 | #158 | Good 10.1% |
| Immigrants | Indonesia | 69.3 /100 | #159 | Good 10.1% |
| Immigrants | Middle Africa | 65.7 /100 | #160 | Good 10.2% |
| New Zealanders | 65.1 /100 | #161 | Good 10.2% |
| Immigrants | Austria | 64.4 /100 | #162 | Good 10.2% |
| Immigrants | Cambodia | 63.7 /100 | #163 | Good 10.2% |
| South Africans | 61.1 /100 | #164 | Good 10.2% |
| Comanche | 60.8 /100 | #165 | Good 10.2% |
| Immigrants | Costa Rica | 60.5 /100 | #166 | Good 10.3% |
| Immigrants | Saudi Arabia | 58.8 /100 | #167 | Average 10.3% |
| Indonesians | 56.7 /100 | #168 | Average 10.3% |