German Russian vs New Zealander No Vehicles in Household
COMPARE
German Russian
New Zealander
No Vehicles in Household
No Vehicles in Household Comparison
German Russians
New Zealanders
10.5%
NO VEHICLES IN HOUSEHOLD
40.6/ 100
METRIC RATING
186th/ 347
METRIC RANK
10.2%
NO VEHICLES IN HOUSEHOLD
65.1/ 100
METRIC RATING
161st/ 347
METRIC RANK
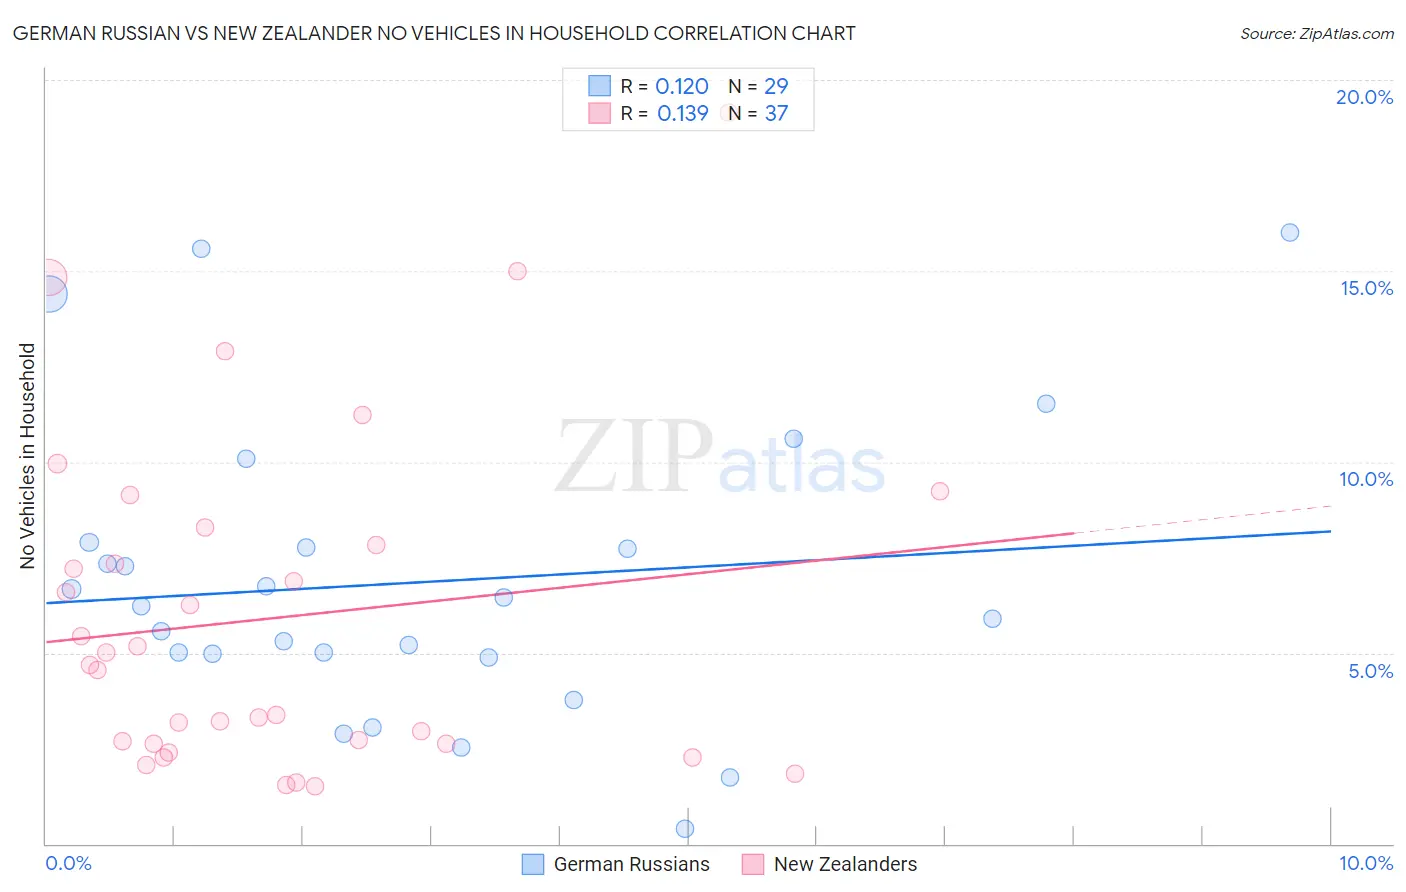
German Russian vs New Zealander No Vehicles in Household Correlation Chart
The statistical analysis conducted on geographies consisting of 96,374,316 people shows a poor positive correlation between the proportion of German Russians and percentage of households with no vehicle available in the United States with a correlation coefficient (R) of 0.120 and weighted average of 10.5%. Similarly, the statistical analysis conducted on geographies consisting of 106,783,580 people shows a poor positive correlation between the proportion of New Zealanders and percentage of households with no vehicle available in the United States with a correlation coefficient (R) of 0.139 and weighted average of 10.2%, a difference of 3.5%.
No Vehicles in Household Correlation Summary
| Measurement | German Russian | New Zealander |
| Minimum | 0.38% | 1.5% |
| Maximum | 16.0% | 19.1% |
| Range | 15.6% | 17.7% |
| Mean | 6.8% | 5.9% |
| Median | 6.2% | 4.7% |
| Interquartile 25% (IQ1) | 4.9% | 2.6% |
| Interquartile 75% (IQ3) | 7.8% | 8.1% |
| Interquartile Range (IQR) | 2.9% | 5.4% |
| Standard Deviation (Sample) | 3.9% | 4.3% |
| Standard Deviation (Population) | 3.8% | 4.3% |
Similar Demographics by No Vehicles in Household
Demographics Similar to German Russians by No Vehicles in Household
In terms of no vehicles in household, the demographic groups most similar to German Russians are South American (10.5%, a difference of 0.18%), Immigrants from Nepal (10.5%, a difference of 0.25%), Immigrants from Poland (10.6%, a difference of 0.31%), Native/Alaskan (10.5%, a difference of 0.42%), and Immigrants from Armenia (10.6%, a difference of 0.43%).
| Demographics | Rating | Rank | No Vehicles in Household |
| Ethiopians | 45.8 /100 | #179 | Average 10.5% |
| Arabs | 45.3 /100 | #180 | Average 10.5% |
| Immigrants | Colombia | 44.1 /100 | #181 | Average 10.5% |
| Immigrants | Bulgaria | 43.8 /100 | #182 | Average 10.5% |
| Natives/Alaskans | 43.7 /100 | #183 | Average 10.5% |
| Immigrants | Nepal | 42.4 /100 | #184 | Average 10.5% |
| South Americans | 41.9 /100 | #185 | Average 10.5% |
| German Russians | 40.6 /100 | #186 | Average 10.5% |
| Immigrants | Poland | 38.4 /100 | #187 | Fair 10.6% |
| Immigrants | Armenia | 37.5 /100 | #188 | Fair 10.6% |
| Immigrants | Eritrea | 36.3 /100 | #189 | Fair 10.6% |
| Immigrants | North Macedonia | 34.6 /100 | #190 | Fair 10.6% |
| Immigrants | Northern Europe | 33.1 /100 | #191 | Fair 10.7% |
| Carpatho Rusyns | 32.1 /100 | #192 | Fair 10.7% |
| Ukrainians | 28.0 /100 | #193 | Fair 10.7% |
Demographics Similar to New Zealanders by No Vehicles in Household
In terms of no vehicles in household, the demographic groups most similar to New Zealanders are Immigrants from Middle Africa (10.2%, a difference of 0.10%), Immigrants from Austria (10.2%, a difference of 0.10%), Immigrants from Cambodia (10.2%, a difference of 0.21%), South African (10.2%, a difference of 0.58%), and Comanche (10.2%, a difference of 0.63%).
| Demographics | Rating | Rank | No Vehicles in Household |
| Sioux | 72.4 /100 | #154 | Good 10.1% |
| Salvadorans | 72.4 /100 | #155 | Good 10.1% |
| Immigrants | Micronesia | 70.9 /100 | #156 | Good 10.1% |
| Australians | 70.6 /100 | #157 | Good 10.1% |
| Spanish American Indians | 70.2 /100 | #158 | Good 10.1% |
| Immigrants | Indonesia | 69.3 /100 | #159 | Good 10.1% |
| Immigrants | Middle Africa | 65.7 /100 | #160 | Good 10.2% |
| New Zealanders | 65.1 /100 | #161 | Good 10.2% |
| Immigrants | Austria | 64.4 /100 | #162 | Good 10.2% |
| Immigrants | Cambodia | 63.7 /100 | #163 | Good 10.2% |
| South Africans | 61.1 /100 | #164 | Good 10.2% |
| Comanche | 60.8 /100 | #165 | Good 10.2% |
| Immigrants | Costa Rica | 60.5 /100 | #166 | Good 10.3% |
| Immigrants | Saudi Arabia | 58.8 /100 | #167 | Average 10.3% |
| Indonesians | 56.7 /100 | #168 | Average 10.3% |