Immigrants from Colombia vs New Zealander No Vehicles in Household
COMPARE
Immigrants from Colombia
New Zealander
No Vehicles in Household
No Vehicles in Household Comparison
Immigrants from Colombia
New Zealanders
10.5%
NO VEHICLES IN HOUSEHOLD
44.1/ 100
METRIC RATING
181st/ 347
METRIC RANK
10.2%
NO VEHICLES IN HOUSEHOLD
65.1/ 100
METRIC RATING
161st/ 347
METRIC RANK
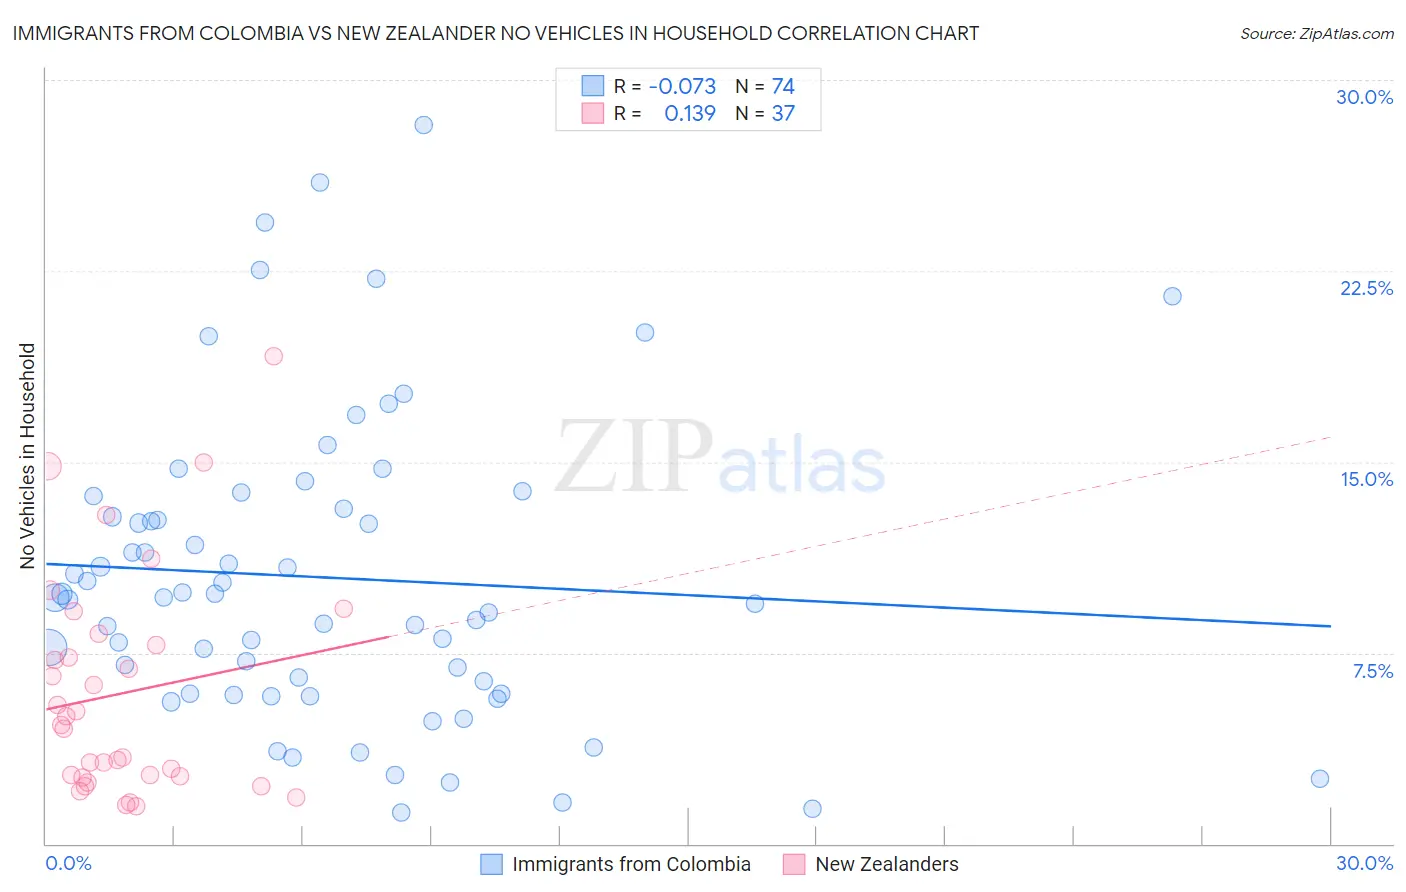
Immigrants from Colombia vs New Zealander No Vehicles in Household Correlation Chart
The statistical analysis conducted on geographies consisting of 362,333,216 people shows a slight negative correlation between the proportion of Immigrants from Colombia and percentage of households with no vehicle available in the United States with a correlation coefficient (R) of -0.073 and weighted average of 10.5%. Similarly, the statistical analysis conducted on geographies consisting of 106,783,580 people shows a poor positive correlation between the proportion of New Zealanders and percentage of households with no vehicle available in the United States with a correlation coefficient (R) of 0.139 and weighted average of 10.2%, a difference of 3.0%.
No Vehicles in Household Correlation Summary
| Measurement | Immigrants from Colombia | New Zealander |
| Minimum | 1.2% | 1.5% |
| Maximum | 28.2% | 19.1% |
| Range | 27.0% | 17.7% |
| Mean | 10.5% | 5.9% |
| Median | 9.7% | 4.7% |
| Interquartile 25% (IQ1) | 5.9% | 2.6% |
| Interquartile 75% (IQ3) | 13.1% | 8.1% |
| Interquartile Range (IQR) | 7.2% | 5.4% |
| Standard Deviation (Sample) | 5.9% | 4.3% |
| Standard Deviation (Population) | 5.9% | 4.3% |
Demographics Similar to Immigrants from Colombia and New Zealanders by No Vehicles in Household
In terms of no vehicles in household, the demographic groups most similar to Immigrants from Colombia are Arab (10.5%, a difference of 0.16%), Ethiopian (10.5%, a difference of 0.22%), Immigrants from Ethiopia (10.4%, a difference of 0.53%), Immigrants from El Salvador (10.4%, a difference of 0.67%), and French American Indian (10.4%, a difference of 0.68%). Similarly, the demographic groups most similar to New Zealanders are Immigrants from Austria (10.2%, a difference of 0.10%), Immigrants from Cambodia (10.2%, a difference of 0.21%), South African (10.2%, a difference of 0.58%), Comanche (10.2%, a difference of 0.63%), and Immigrants from Costa Rica (10.3%, a difference of 0.68%).
| Demographics | Rating | Rank | No Vehicles in Household |
| New Zealanders | 65.1 /100 | #161 | Good 10.2% |
| Immigrants | Austria | 64.4 /100 | #162 | Good 10.2% |
| Immigrants | Cambodia | 63.7 /100 | #163 | Good 10.2% |
| South Africans | 61.1 /100 | #164 | Good 10.2% |
| Comanche | 60.8 /100 | #165 | Good 10.2% |
| Immigrants | Costa Rica | 60.5 /100 | #166 | Good 10.3% |
| Immigrants | Saudi Arabia | 58.8 /100 | #167 | Average 10.3% |
| Indonesians | 56.7 /100 | #168 | Average 10.3% |
| Lumbee | 54.7 /100 | #169 | Average 10.3% |
| Immigrants | Latin America | 53.2 /100 | #170 | Average 10.4% |
| Hmong | 52.7 /100 | #171 | Average 10.4% |
| Brazilians | 51.7 /100 | #172 | Average 10.4% |
| Filipinos | 50.1 /100 | #173 | Average 10.4% |
| Immigrants | Sudan | 50.0 /100 | #174 | Average 10.4% |
| Immigrants | Burma/Myanmar | 49.1 /100 | #175 | Average 10.4% |
| French American Indians | 49.1 /100 | #176 | Average 10.4% |
| Immigrants | El Salvador | 49.1 /100 | #177 | Average 10.4% |
| Immigrants | Ethiopia | 48.0 /100 | #178 | Average 10.4% |
| Ethiopians | 45.8 /100 | #179 | Average 10.5% |
| Arabs | 45.3 /100 | #180 | Average 10.5% |
| Immigrants | Colombia | 44.1 /100 | #181 | Average 10.5% |