Paiute vs New Zealander No Vehicles in Household
COMPARE
Paiute
New Zealander
No Vehicles in Household
No Vehicles in Household Comparison
Paiute
New Zealanders
11.8%
NO VEHICLES IN HOUSEHOLD
1.8/ 100
METRIC RATING
250th/ 347
METRIC RANK
10.2%
NO VEHICLES IN HOUSEHOLD
65.1/ 100
METRIC RATING
161st/ 347
METRIC RANK
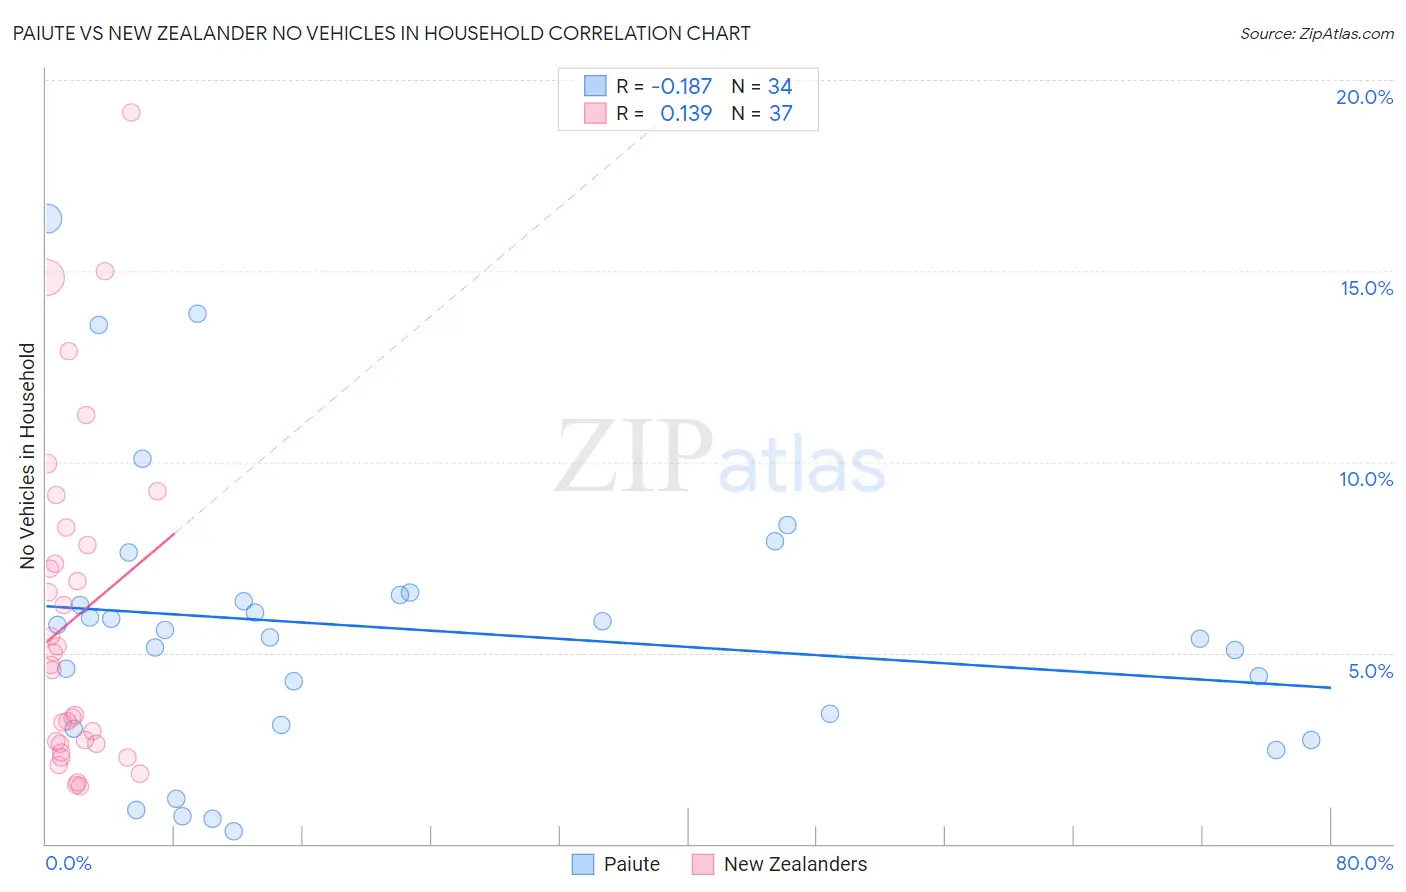
Paiute vs New Zealander No Vehicles in Household Correlation Chart
The statistical analysis conducted on geographies consisting of 58,352,157 people shows a poor negative correlation between the proportion of Paiute and percentage of households with no vehicle available in the United States with a correlation coefficient (R) of -0.187 and weighted average of 11.8%. Similarly, the statistical analysis conducted on geographies consisting of 106,783,580 people shows a poor positive correlation between the proportion of New Zealanders and percentage of households with no vehicle available in the United States with a correlation coefficient (R) of 0.139 and weighted average of 10.2%, a difference of 16.0%.
No Vehicles in Household Correlation Summary
| Measurement | Paiute | New Zealander |
| Minimum | 0.32% | 1.5% |
| Maximum | 16.4% | 19.1% |
| Range | 16.0% | 17.7% |
| Mean | 5.6% | 5.9% |
| Median | 5.5% | 4.7% |
| Interquartile 25% (IQ1) | 3.1% | 2.6% |
| Interquartile 75% (IQ3) | 6.5% | 8.1% |
| Interquartile Range (IQR) | 3.4% | 5.4% |
| Standard Deviation (Sample) | 3.7% | 4.3% |
| Standard Deviation (Population) | 3.6% | 4.3% |
Similar Demographics by No Vehicles in Household
Demographics Similar to Paiute by No Vehicles in Household
In terms of no vehicles in household, the demographic groups most similar to Paiute are Immigrants from Nigeria (11.8%, a difference of 0.22%), Immigrants from Czechoslovakia (11.8%, a difference of 0.26%), Immigrants from Belgium (11.8%, a difference of 0.26%), Menominee (11.8%, a difference of 0.32%), and Black/African American (11.9%, a difference of 0.35%).
| Demographics | Rating | Rank | No Vehicles in Household |
| Cheyenne | 2.4 /100 | #243 | Tragic 11.7% |
| Immigrants | Portugal | 2.2 /100 | #244 | Tragic 11.7% |
| Immigrants | Honduras | 2.1 /100 | #245 | Tragic 11.8% |
| Menominee | 2.0 /100 | #246 | Tragic 11.8% |
| Immigrants | Czechoslovakia | 2.0 /100 | #247 | Tragic 11.8% |
| Immigrants | Belgium | 1.9 /100 | #248 | Tragic 11.8% |
| Immigrants | Nigeria | 1.9 /100 | #249 | Tragic 11.8% |
| Paiute | 1.8 /100 | #250 | Tragic 11.8% |
| Blacks/African Americans | 1.6 /100 | #251 | Tragic 11.9% |
| Immigrants | Serbia | 1.5 /100 | #252 | Tragic 11.9% |
| Egyptians | 1.4 /100 | #253 | Tragic 11.9% |
| Immigrants | Uruguay | 1.3 /100 | #254 | Tragic 11.9% |
| Hondurans | 1.2 /100 | #255 | Tragic 12.0% |
| Liberians | 1.2 /100 | #256 | Tragic 12.0% |
| Nigerians | 0.9 /100 | #257 | Tragic 12.1% |
Demographics Similar to New Zealanders by No Vehicles in Household
In terms of no vehicles in household, the demographic groups most similar to New Zealanders are Immigrants from Middle Africa (10.2%, a difference of 0.10%), Immigrants from Austria (10.2%, a difference of 0.10%), Immigrants from Cambodia (10.2%, a difference of 0.21%), South African (10.2%, a difference of 0.58%), and Comanche (10.2%, a difference of 0.63%).
| Demographics | Rating | Rank | No Vehicles in Household |
| Sioux | 72.4 /100 | #154 | Good 10.1% |
| Salvadorans | 72.4 /100 | #155 | Good 10.1% |
| Immigrants | Micronesia | 70.9 /100 | #156 | Good 10.1% |
| Australians | 70.6 /100 | #157 | Good 10.1% |
| Spanish American Indians | 70.2 /100 | #158 | Good 10.1% |
| Immigrants | Indonesia | 69.3 /100 | #159 | Good 10.1% |
| Immigrants | Middle Africa | 65.7 /100 | #160 | Good 10.2% |
| New Zealanders | 65.1 /100 | #161 | Good 10.2% |
| Immigrants | Austria | 64.4 /100 | #162 | Good 10.2% |
| Immigrants | Cambodia | 63.7 /100 | #163 | Good 10.2% |
| South Africans | 61.1 /100 | #164 | Good 10.2% |
| Comanche | 60.8 /100 | #165 | Good 10.2% |
| Immigrants | Costa Rica | 60.5 /100 | #166 | Good 10.3% |
| Immigrants | Saudi Arabia | 58.8 /100 | #167 | Average 10.3% |
| Indonesians | 56.7 /100 | #168 | Average 10.3% |