West Indian vs German Russian Average Family Size
COMPARE
West Indian
German Russian
Average Family Size
Average Family Size Comparison
West Indians
German Russians
3.29
AVERAGE FAMILY SIZE
98.5/ 100
METRIC RATING
102nd/ 347
METRIC RANK
3.15
AVERAGE FAMILY SIZE
0.4/ 100
METRIC RATING
283rd/ 347
METRIC RANK
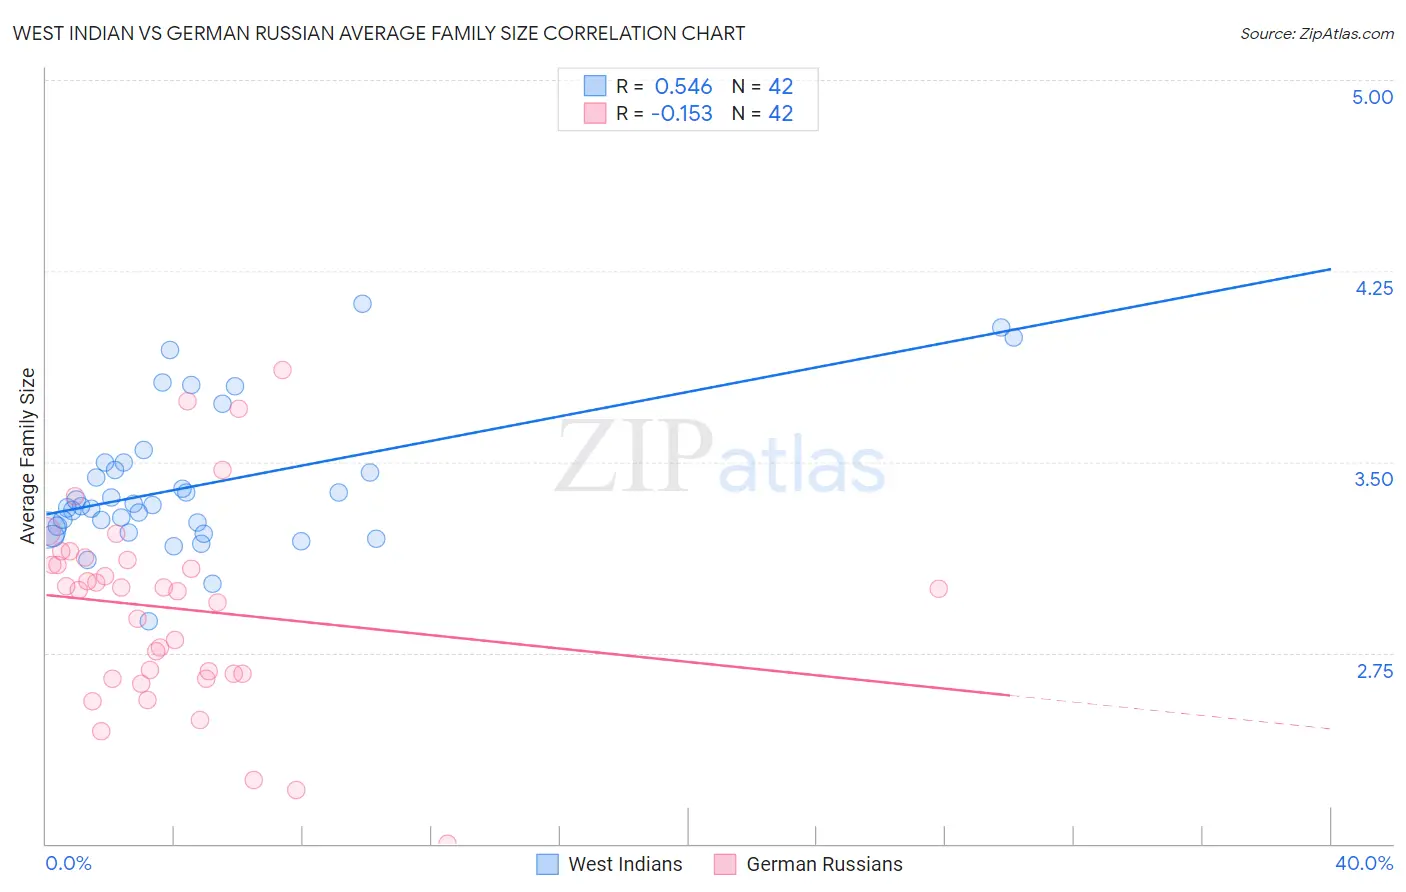
West Indian vs German Russian Average Family Size Correlation Chart
The statistical analysis conducted on geographies consisting of 253,859,351 people shows a substantial positive correlation between the proportion of West Indians and average family size in the United States with a correlation coefficient (R) of 0.546 and weighted average of 3.29. Similarly, the statistical analysis conducted on geographies consisting of 96,451,127 people shows a poor negative correlation between the proportion of German Russians and average family size in the United States with a correlation coefficient (R) of -0.153 and weighted average of 3.15, a difference of 4.6%.
Average Family Size Correlation Summary
| Measurement | West Indian | German Russian |
| Minimum | 2.87 | 2.00 |
| Maximum | 4.12 | 3.86 |
| Range | 1.25 | 1.86 |
| Mean | 3.41 | 2.92 |
| Median | 3.33 | 3.00 |
| Interquartile 25% (IQ1) | 3.23 | 2.67 |
| Interquartile 75% (IQ3) | 3.50 | 3.11 |
| Interquartile Range (IQR) | 0.26 | 0.44 |
| Standard Deviation (Sample) | 0.28 | 0.39 |
| Standard Deviation (Population) | 0.27 | 0.38 |
Similar Demographics by Average Family Size
Demographics Similar to West Indians by Average Family Size
In terms of average family size, the demographic groups most similar to West Indians are Immigrants from Burma/Myanmar (3.29, a difference of 0.010%), Guamanian/Chamorro (3.29, a difference of 0.020%), Barbadian (3.29, a difference of 0.030%), Nigerian (3.29, a difference of 0.030%), and Immigrants from Western Africa (3.29, a difference of 0.030%).
| Demographics | Rating | Rank | Average Family Size |
| Immigrants | Lebanon | 99.0 /100 | #95 | Exceptional 3.30 |
| U.S. Virgin Islanders | 98.8 /100 | #96 | Exceptional 3.29 |
| Immigrants | Oceania | 98.7 /100 | #97 | Exceptional 3.29 |
| Barbadians | 98.6 /100 | #98 | Exceptional 3.29 |
| Nigerians | 98.6 /100 | #99 | Exceptional 3.29 |
| Guamanians/Chamorros | 98.6 /100 | #100 | Exceptional 3.29 |
| Immigrants | Burma/Myanmar | 98.6 /100 | #101 | Exceptional 3.29 |
| West Indians | 98.5 /100 | #102 | Exceptional 3.29 |
| Immigrants | Western Africa | 98.4 /100 | #103 | Exceptional 3.29 |
| Bolivians | 98.3 /100 | #104 | Exceptional 3.29 |
| Immigrants | Ghana | 98.1 /100 | #105 | Exceptional 3.29 |
| Paiute | 98.0 /100 | #106 | Exceptional 3.29 |
| Ghanaians | 98.0 /100 | #107 | Exceptional 3.29 |
| Asians | 97.0 /100 | #108 | Exceptional 3.28 |
| Puerto Ricans | 96.7 /100 | #109 | Exceptional 3.28 |
Demographics Similar to German Russians by Average Family Size
In terms of average family size, the demographic groups most similar to German Russians are Yugoslavian (3.15, a difference of 0.010%), Immigrants from Denmark (3.15, a difference of 0.020%), Immigrants from France (3.15, a difference of 0.020%), Immigrants from England (3.15, a difference of 0.060%), and White/Caucasian (3.14, a difference of 0.070%).
| Demographics | Rating | Rank | Average Family Size |
| Immigrants | Bosnia and Herzegovina | 0.5 /100 | #276 | Tragic 3.15 |
| Swiss | 0.5 /100 | #277 | Tragic 3.15 |
| Okinawans | 0.5 /100 | #278 | Tragic 3.15 |
| Immigrants | Europe | 0.5 /100 | #279 | Tragic 3.15 |
| Immigrants | England | 0.4 /100 | #280 | Tragic 3.15 |
| Immigrants | Denmark | 0.4 /100 | #281 | Tragic 3.15 |
| Yugoslavians | 0.4 /100 | #282 | Tragic 3.15 |
| German Russians | 0.4 /100 | #283 | Tragic 3.15 |
| Immigrants | France | 0.4 /100 | #284 | Tragic 3.15 |
| Whites/Caucasians | 0.3 /100 | #285 | Tragic 3.14 |
| Immigrants | Netherlands | 0.3 /100 | #286 | Tragic 3.14 |
| Greeks | 0.3 /100 | #287 | Tragic 3.14 |
| Immigrants | Czechoslovakia | 0.3 /100 | #288 | Tragic 3.14 |
| Immigrants | Norway | 0.3 /100 | #289 | Tragic 3.14 |
| Cypriots | 0.3 /100 | #290 | Tragic 3.14 |