West Indian vs German Russian 9th Grade
COMPARE
West Indian
German Russian
9th Grade
9th Grade Comparison
West Indians
German Russians
93.7%
9TH GRADE
0.2/ 100
METRIC RATING
276th/ 347
METRIC RANK
95.4%
9TH GRADE
96.1/ 100
METRIC RATING
114th/ 347
METRIC RANK
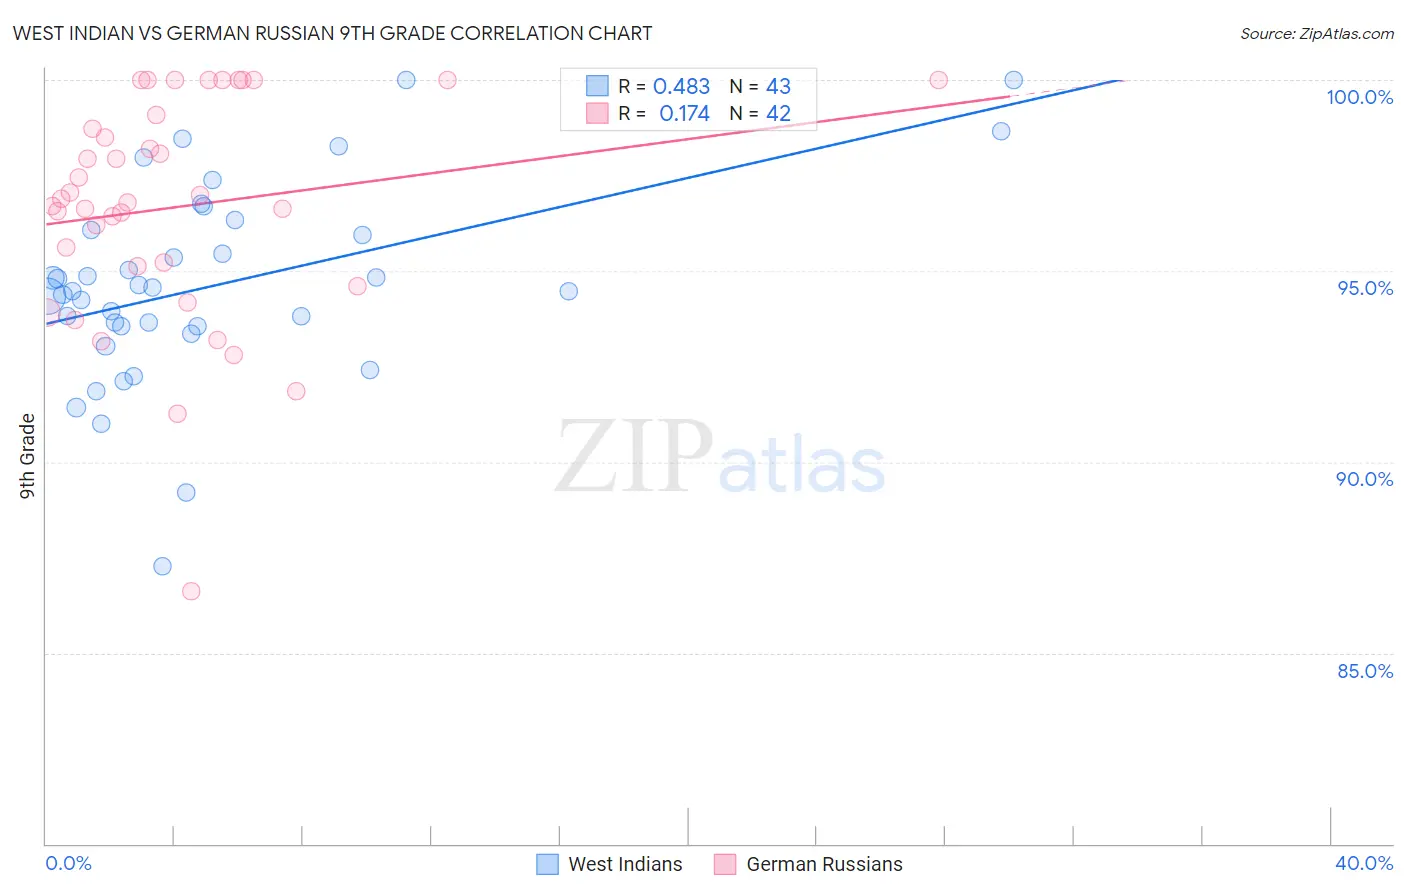
West Indian vs German Russian 9th Grade Correlation Chart
The statistical analysis conducted on geographies consisting of 254,059,006 people shows a moderate positive correlation between the proportion of West Indians and percentage of population with at least 9th grade education in the United States with a correlation coefficient (R) of 0.483 and weighted average of 93.7%. Similarly, the statistical analysis conducted on geographies consisting of 96,461,461 people shows a poor positive correlation between the proportion of German Russians and percentage of population with at least 9th grade education in the United States with a correlation coefficient (R) of 0.174 and weighted average of 95.4%, a difference of 1.8%.
9th Grade Correlation Summary
| Measurement | West Indian | German Russian |
| Minimum | 87.3% | 86.6% |
| Maximum | 100.0% | 100.0% |
| Range | 12.7% | 13.4% |
| Mean | 94.6% | 96.7% |
| Median | 94.5% | 96.8% |
| Interquartile 25% (IQ1) | 93.5% | 95.1% |
| Interquartile 75% (IQ3) | 96.1% | 99.1% |
| Interquartile Range (IQR) | 2.5% | 4.0% |
| Standard Deviation (Sample) | 2.6% | 3.0% |
| Standard Deviation (Population) | 2.6% | 2.9% |
Similar Demographics by 9th Grade
Demographics Similar to West Indians by 9th Grade
In terms of 9th grade, the demographic groups most similar to West Indians are Immigrants from Philippines (93.7%, a difference of 0.010%), Immigrants from Eritrea (93.7%, a difference of 0.010%), Immigrants from Colombia (93.8%, a difference of 0.020%), Immigrants from South America (93.8%, a difference of 0.030%), and Peruvian (93.8%, a difference of 0.030%).
| Demographics | Rating | Rank | 9th Grade |
| Immigrants | Uruguay | 0.2 /100 | #269 | Tragic 93.8% |
| Yuman | 0.2 /100 | #270 | Tragic 93.8% |
| Immigrants | Ghana | 0.2 /100 | #271 | Tragic 93.8% |
| Immigrants | Western Africa | 0.2 /100 | #272 | Tragic 93.8% |
| Immigrants | South America | 0.2 /100 | #273 | Tragic 93.8% |
| Peruvians | 0.2 /100 | #274 | Tragic 93.8% |
| Immigrants | Colombia | 0.2 /100 | #275 | Tragic 93.8% |
| West Indians | 0.2 /100 | #276 | Tragic 93.7% |
| Immigrants | Philippines | 0.1 /100 | #277 | Tragic 93.7% |
| Immigrants | Eritrea | 0.1 /100 | #278 | Tragic 93.7% |
| Trinidadians and Tobagonians | 0.1 /100 | #279 | Tragic 93.7% |
| Taiwanese | 0.1 /100 | #280 | Tragic 93.6% |
| Immigrants | Trinidad and Tobago | 0.1 /100 | #281 | Tragic 93.6% |
| Malaysians | 0.0 /100 | #282 | Tragic 93.5% |
| Barbadians | 0.0 /100 | #283 | Tragic 93.5% |
Demographics Similar to German Russians by 9th Grade
In terms of 9th grade, the demographic groups most similar to German Russians are Iroquois (95.4%, a difference of 0.0%), Burmese (95.4%, a difference of 0.0%), Cherokee (95.4%, a difference of 0.010%), Immigrants from Croatia (95.4%, a difference of 0.010%), and Immigrants from Europe (95.4%, a difference of 0.020%).
| Demographics | Rating | Rank | 9th Grade |
| Immigrants | Zimbabwe | 96.9 /100 | #107 | Exceptional 95.5% |
| Chickasaw | 96.8 /100 | #108 | Exceptional 95.5% |
| Osage | 96.8 /100 | #109 | Exceptional 95.5% |
| Immigrants | Bulgaria | 96.7 /100 | #110 | Exceptional 95.5% |
| Cherokee | 96.3 /100 | #111 | Exceptional 95.4% |
| Immigrants | Croatia | 96.2 /100 | #112 | Exceptional 95.4% |
| Iroquois | 96.2 /100 | #113 | Exceptional 95.4% |
| German Russians | 96.1 /100 | #114 | Exceptional 95.4% |
| Burmese | 96.0 /100 | #115 | Exceptional 95.4% |
| Immigrants | Europe | 95.7 /100 | #116 | Exceptional 95.4% |
| Immigrants | Romania | 95.6 /100 | #117 | Exceptional 95.4% |
| Immigrants | Turkey | 95.6 /100 | #118 | Exceptional 95.4% |
| Soviet Union | 95.6 /100 | #119 | Exceptional 95.4% |
| Cambodians | 95.6 /100 | #120 | Exceptional 95.4% |
| Cree | 95.5 /100 | #121 | Exceptional 95.4% |