Vietnamese vs Immigrants from Caribbean Householder Income Ages 25 - 44 years
COMPARE
Vietnamese
Immigrants from Caribbean
Householder Income Ages 25 - 44 years
Householder Income Ages 25 - 44 years Comparison
Vietnamese
Immigrants from Caribbean
$92,089
HOUSEHOLDER INCOME AGES 25 - 44 YEARS
20.2/ 100
METRIC RATING
198th/ 347
METRIC RANK
$80,326
HOUSEHOLDER INCOME AGES 25 - 44 YEARS
0.0/ 100
METRIC RATING
304th/ 347
METRIC RANK
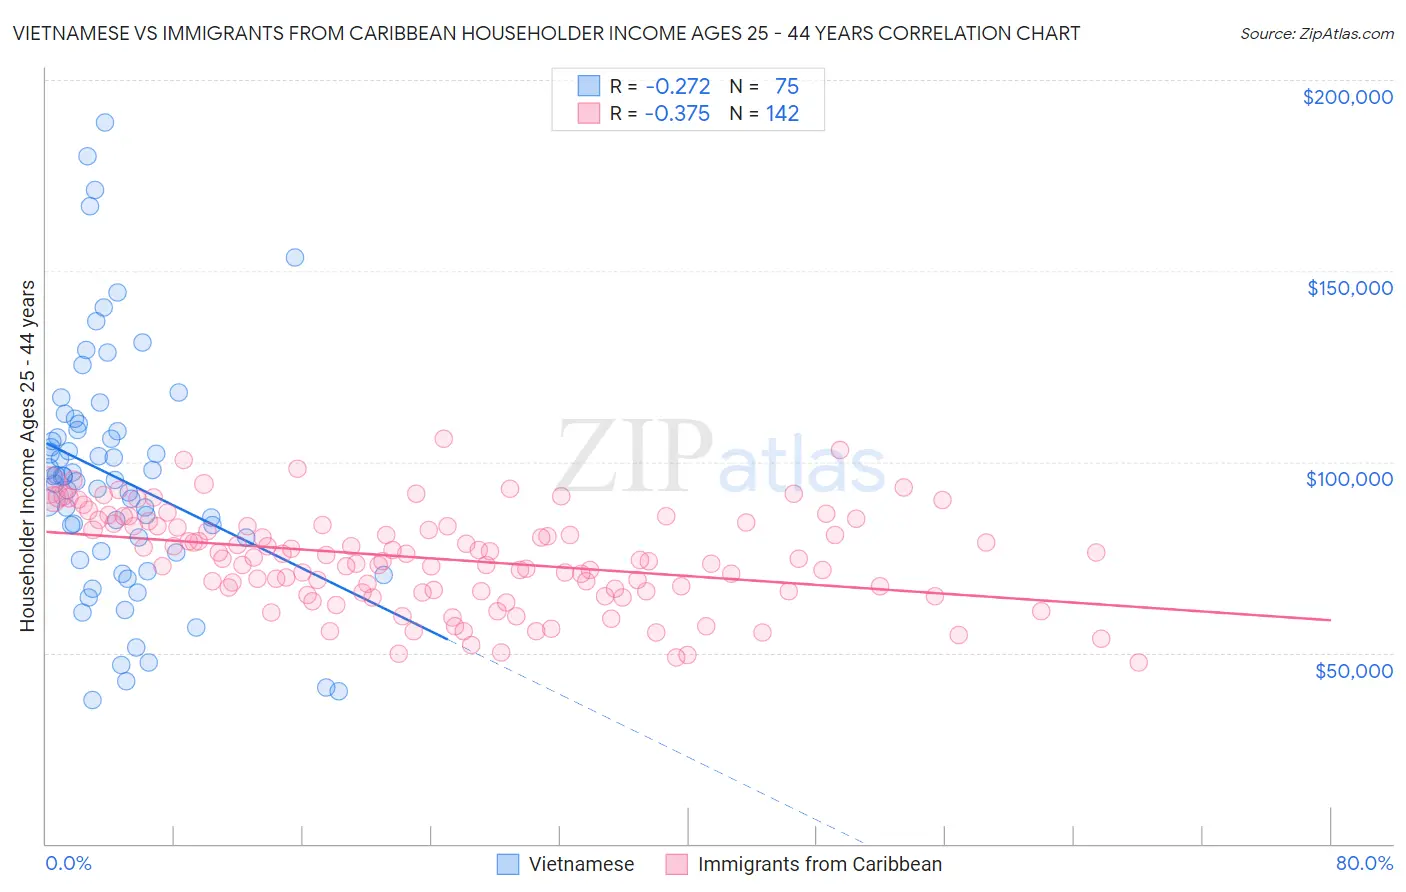
Vietnamese vs Immigrants from Caribbean Householder Income Ages 25 - 44 years Correlation Chart
The statistical analysis conducted on geographies consisting of 170,555,303 people shows a weak negative correlation between the proportion of Vietnamese and household income with householder between the ages 25 and 44 in the United States with a correlation coefficient (R) of -0.272 and weighted average of $92,089. Similarly, the statistical analysis conducted on geographies consisting of 448,247,507 people shows a mild negative correlation between the proportion of Immigrants from Caribbean and household income with householder between the ages 25 and 44 in the United States with a correlation coefficient (R) of -0.375 and weighted average of $80,326, a difference of 14.6%.
Householder Income Ages 25 - 44 years Correlation Summary
| Measurement | Vietnamese | Immigrants from Caribbean |
| Minimum | $37,508 | $47,510 |
| Maximum | $188,772 | $105,938 |
| Range | $151,264 | $58,428 |
| Mean | $95,810 | $74,665 |
| Median | $95,390 | $74,621 |
| Interquartile 25% (IQ1) | $76,300 | $66,150 |
| Interquartile 75% (IQ3) | $108,353 | $83,625 |
| Interquartile Range (IQR) | $32,053 | $17,475 |
| Standard Deviation (Sample) | $31,666 | $12,546 |
| Standard Deviation (Population) | $31,454 | $12,502 |
Similar Demographics by Householder Income Ages 25 - 44 years
Demographics Similar to Vietnamese by Householder Income Ages 25 - 44 years
In terms of householder income ages 25 - 44 years, the demographic groups most similar to Vietnamese are Immigrants from Colombia ($92,204, a difference of 0.12%), Spanish ($92,200, a difference of 0.12%), Celtic ($92,241, a difference of 0.16%), Immigrants from the Azores ($92,322, a difference of 0.25%), and Samoan ($92,385, a difference of 0.32%).
| Demographics | Rating | Rank | Householder Income Ages 25 - 44 years |
| Tlingit-Haida | 29.4 /100 | #191 | Fair $92,987 |
| Immigrants | Costa Rica | 28.2 /100 | #192 | Fair $92,876 |
| Samoans | 23.0 /100 | #193 | Fair $92,385 |
| Immigrants | Azores | 22.4 /100 | #194 | Fair $92,322 |
| Celtics | 21.6 /100 | #195 | Fair $92,241 |
| Immigrants | Colombia | 21.3 /100 | #196 | Fair $92,204 |
| Spanish | 21.2 /100 | #197 | Fair $92,200 |
| Vietnamese | 20.2 /100 | #198 | Fair $92,089 |
| Kenyans | 16.8 /100 | #199 | Poor $91,684 |
| Whites/Caucasians | 16.7 /100 | #200 | Poor $91,668 |
| Japanese | 16.4 /100 | #201 | Poor $91,624 |
| Ecuadorians | 16.0 /100 | #202 | Poor $91,574 |
| Immigrants | Cambodia | 15.7 /100 | #203 | Poor $91,533 |
| Nepalese | 15.4 /100 | #204 | Poor $91,498 |
| Immigrants | Eastern Africa | 15.2 /100 | #205 | Poor $91,458 |
Demographics Similar to Immigrants from Caribbean by Householder Income Ages 25 - 44 years
In terms of householder income ages 25 - 44 years, the demographic groups most similar to Immigrants from Caribbean are Immigrants from Dominican Republic ($80,319, a difference of 0.010%), Apache ($80,260, a difference of 0.080%), Mexican ($80,427, a difference of 0.13%), Hispanic or Latino ($80,515, a difference of 0.24%), and Immigrants from Micronesia ($80,544, a difference of 0.27%).
| Demographics | Rating | Rank | Householder Income Ages 25 - 44 years |
| Immigrants | Guatemala | 0.1 /100 | #297 | Tragic $81,341 |
| Dominicans | 0.1 /100 | #298 | Tragic $81,229 |
| Immigrants | Liberia | 0.1 /100 | #299 | Tragic $80,863 |
| Cherokee | 0.0 /100 | #300 | Tragic $80,843 |
| Immigrants | Micronesia | 0.0 /100 | #301 | Tragic $80,544 |
| Hispanics or Latinos | 0.0 /100 | #302 | Tragic $80,515 |
| Mexicans | 0.0 /100 | #303 | Tragic $80,427 |
| Immigrants | Caribbean | 0.0 /100 | #304 | Tragic $80,326 |
| Immigrants | Dominican Republic | 0.0 /100 | #305 | Tragic $80,319 |
| Apache | 0.0 /100 | #306 | Tragic $80,260 |
| Haitians | 0.0 /100 | #307 | Tragic $80,055 |
| Immigrants | Central America | 0.0 /100 | #308 | Tragic $80,012 |
| Chippewa | 0.0 /100 | #309 | Tragic $80,005 |
| Fijians | 0.0 /100 | #310 | Tragic $79,956 |
| Indonesians | 0.0 /100 | #311 | Tragic $79,543 |