U.S. Virgin Islander vs Bermudan In Labor Force | Age 35-44

COMPARE

U.S. Virgin Islander
Race
Ancestry
AfghanAfricanAlaska NativeAlaskan AthabascanAlbanianAleutAlsatianAmericanApacheArabArapahoArgentineanArmenianAssyrian/Chaldean/SyriacAustralianAustrianBahamianBangladeshiBarbadianBasqueBelgianBelizeanBhutaneseBlackfeetBolivianBrazilianBritishBritish West IndianBulgarianBurmeseCajunCambodianCanadianCape VerdeanCarpatho RusynCelticCentral AmericanCentral American IndianCherokeeCheyenneChickasawChileanChineseChippewaChoctawColombianColvilleComancheCosta RicanCreeCreekCroatianCrowCubanCypriotCzechCzechoslovakianDanishDelawareDominicanDutchDutch West IndianEastern EuropeanEcuadorianEgyptianEnglishEstonianEthiopianEuropeanFijianFilipinoFinnishFrenchFrench American IndianFrench CanadianGermanGerman RussianGhanaianGreekGuamanian/ChamorroGuatemalanGuyaneseHaitianHmongHonduranHopiHoumaHungarianIcelanderIndian (Asian)IndonesianInupiatIranianIraqiIrishIroquoisIsraeliItalianJamaicanJapaneseJordanianKenyanKiowaKoreanLaotianLatvianLebaneseLiberianLithuanianLumbeeLuxembourgerMacedonianMalaysianMalteseMarshalleseMenomineeMexicanMexican American IndianMongolianMoroccanNative HawaiianNavajoNepaleseNew ZealanderNicaraguanNigerianNorthern EuropeanNorwegianOkinawanOsageOttawaPaiutePakistaniPalestinianPanamanianParaguayanPennsylvania GermanPeruvianPimaPolishPortuguesePotawatomiPuebloPuerto RicanPuget Sound SalishRomanianRussianSalvadoranSamoanScandinavianScotch-IrishScottishSeminoleSenegaleseSerbianShoshoneSierra LeoneanSiouxSlavicSlovakSloveneSomaliSouth AfricanSouth AmericanSouth American IndianSoviet UnionSpaniardSpanishSpanish AmericanSpanish American IndianSri LankanSubsaharan AfricanSudaneseSwedishSwissSyrianTaiwaneseThaiTlingit-HaidaTohono O'OdhamTonganTrinidadian and TobagonianTsimshianTurkishU.S. Virgin IslanderUgandanUkrainianUruguayanUteVenezuelanVietnameseWelshWest IndianYakamaYaquiYugoslavianYumanYup'ikZimbabwean
Immigration
NonimmigrantsImmigrantsAfghanistanAfricaAlbaniaArgentinaArmeniaAsiaAustraliaAustriaBahamasBangladeshBarbadosBelarusBelgiumBelizeBoliviaBosnia and HerzegovinaBrazilBulgariaBurma/MyanmarCabo VerdeCambodiaCameroonCanadaCaribbeanCentral AmericaChileChinaColombiaCongoCosta RicaCroatiaCubaCzechoslovakiaDenmarkDominicaDominican RepublicEastern AfricaEastern AsiaEastern EuropeEcuadorEgyptEl SalvadorEnglandEritreaEthiopiaEuropeFijiFranceGermanyGhanaGreeceGrenadaGuatemalaGuyanaHaitiHondurasHong KongHungaryIndiaIndonesiaIranIraqIrelandIsraelItalyJamaicaJapanJordanKazakhstanKenyaKoreaKuwaitLaosLatin AmericaLatviaLebanonLiberiaLithuaniaMalaysiaMexicoMicronesiaMiddle AfricaMoldovaMoroccoNepalNetherlandsNicaraguaNigeriaNorth AmericaNorth MacedoniaNorthern AfricaNorthern EuropeNorwayOceaniaPakistanPanamaPeruPhilippinesPolandPortugalRomaniaRussiaSaudi ArabiaScotlandSenegalSerbiaSierra LeoneSingaporeSomaliaSouth AfricaSouth AmericaSouth Central AsiaSouth Eastern AsiaSouthern EuropeSpainSri LankaSt. Vincent and the GrenadinesSudanSwedenSwitzerlandSyriaTaiwanThailandTrinidad and TobagoTurkeyUgandaUkraineUruguayUzbekistanVenezuelaVietnamWest IndiesWestern AfricaWestern AsiaWestern EuropeYemenZaireZimbabweAzores
Bermudan
Race
Ancestry
AfghanAfricanAlaska NativeAlaskan AthabascanAlbanianAleutAlsatianAmericanApacheArabArapahoArgentineanArmenianAssyrian/Chaldean/SyriacAustralianAustrianBahamianBangladeshiBarbadianBasqueBelgianBelizeanBermudanBhutaneseBlackfeetBolivianBrazilianBritishBritish West IndianBulgarianBurmeseCajunCambodianCanadianCape VerdeanCarpatho RusynCelticCentral AmericanCentral American IndianCherokeeCheyenneChickasawChileanChineseChippewaChoctawColombianColvilleComancheCosta RicanCreeCreekCroatianCrowCubanCypriotCzechCzechoslovakianDanishDelawareDominicanDutchDutch West IndianEastern EuropeanEcuadorianEgyptianEnglishEstonianEthiopianEuropeanFijianFilipinoFinnishFrenchFrench American IndianFrench CanadianGermanGerman RussianGhanaianGreekGuamanian/ChamorroGuatemalanGuyaneseHaitianHmongHonduranHopiHoumaHungarianIcelanderIndian (Asian)IndonesianInupiatIranianIraqiIrishIroquoisIsraeliItalianJamaicanJapaneseJordanianKenyanKiowaKoreanLaotianLatvianLebaneseLiberianLithuanianLumbeeLuxembourgerMacedonianMalaysianMalteseMarshalleseMenomineeMexicanMexican American IndianMongolianMoroccanNative HawaiianNavajoNepaleseNew ZealanderNicaraguanNigerianNorthern EuropeanNorwegianOkinawanOsageOttawaPaiutePakistaniPalestinianPanamanianParaguayanPennsylvania GermanPeruvianPimaPolishPortuguesePotawatomiPuebloPuerto RicanPuget Sound SalishRomanianRussianSalvadoranSamoanScandinavianScotch-IrishScottishSeminoleSenegaleseSerbianShoshoneSierra LeoneanSiouxSlavicSlovakSloveneSomaliSouth AfricanSouth AmericanSouth American IndianSoviet UnionSpaniardSpanishSpanish AmericanSpanish American IndianSri LankanSubsaharan AfricanSudaneseSwedishSwissSyrianTaiwaneseThaiTlingit-HaidaTohono O'OdhamTonganTrinidadian and TobagonianTsimshianTurkishUgandanUkrainianUruguayanUteVenezuelanVietnameseWelshWest IndianYakamaYaquiYugoslavianYumanYup'ikZimbabwean
Immigration
NonimmigrantsImmigrantsAfghanistanAfricaAlbaniaArgentinaArmeniaAsiaAustraliaAustriaBahamasBangladeshBarbadosBelarusBelgiumBelizeBoliviaBosnia and HerzegovinaBrazilBulgariaBurma/MyanmarCabo VerdeCambodiaCameroonCanadaCaribbeanCentral AmericaChileChinaColombiaCongoCosta RicaCroatiaCubaCzechoslovakiaDenmarkDominicaDominican RepublicEastern AfricaEastern AsiaEastern EuropeEcuadorEgyptEl SalvadorEnglandEritreaEthiopiaEuropeFijiFranceGermanyGhanaGreeceGrenadaGuatemalaGuyanaHaitiHondurasHong KongHungaryIndiaIndonesiaIranIraqIrelandIsraelItalyJamaicaJapanJordanKazakhstanKenyaKoreaKuwaitLaosLatin AmericaLatviaLebanonLiberiaLithuaniaMalaysiaMexicoMicronesiaMiddle AfricaMoldovaMoroccoNepalNetherlandsNicaraguaNigeriaNorth AmericaNorth MacedoniaNorthern AfricaNorthern EuropeNorwayOceaniaPakistanPanamaPeruPhilippinesPolandPortugalRomaniaRussiaSaudi ArabiaScotlandSenegalSerbiaSierra LeoneSingaporeSomaliaSouth AfricaSouth AmericaSouth Central AsiaSouth Eastern AsiaSouthern EuropeSpainSri LankaSt. Vincent and the GrenadinesSudanSwedenSwitzerlandSyriaTaiwanThailandTrinidad and TobagoTurkeyUgandaUkraineUruguayUzbekistanVenezuelaVietnamWest IndiesWestern AfricaWestern AsiaWestern EuropeYemenZaireZimbabweAzores
In Labor Force | Age 35-44
Income
Poverty
Unemployment
Labor Participation
Family Structure
Vehicle Availability
Education Level
Disability

In Labor Force | Age 35-44 Comparison

U.S. Virgin Islanders

Bermudans

Tragic
Exceptional
84.0%
IN LABOR FORCE | AGE 35-44
6.1/ 100
METRIC RATING
224th/ 347
METRIC RANK
85.3%
IN LABOR FORCE | AGE 35-44
99.9/ 100
METRIC RATING
30th/ 347
METRIC RANK

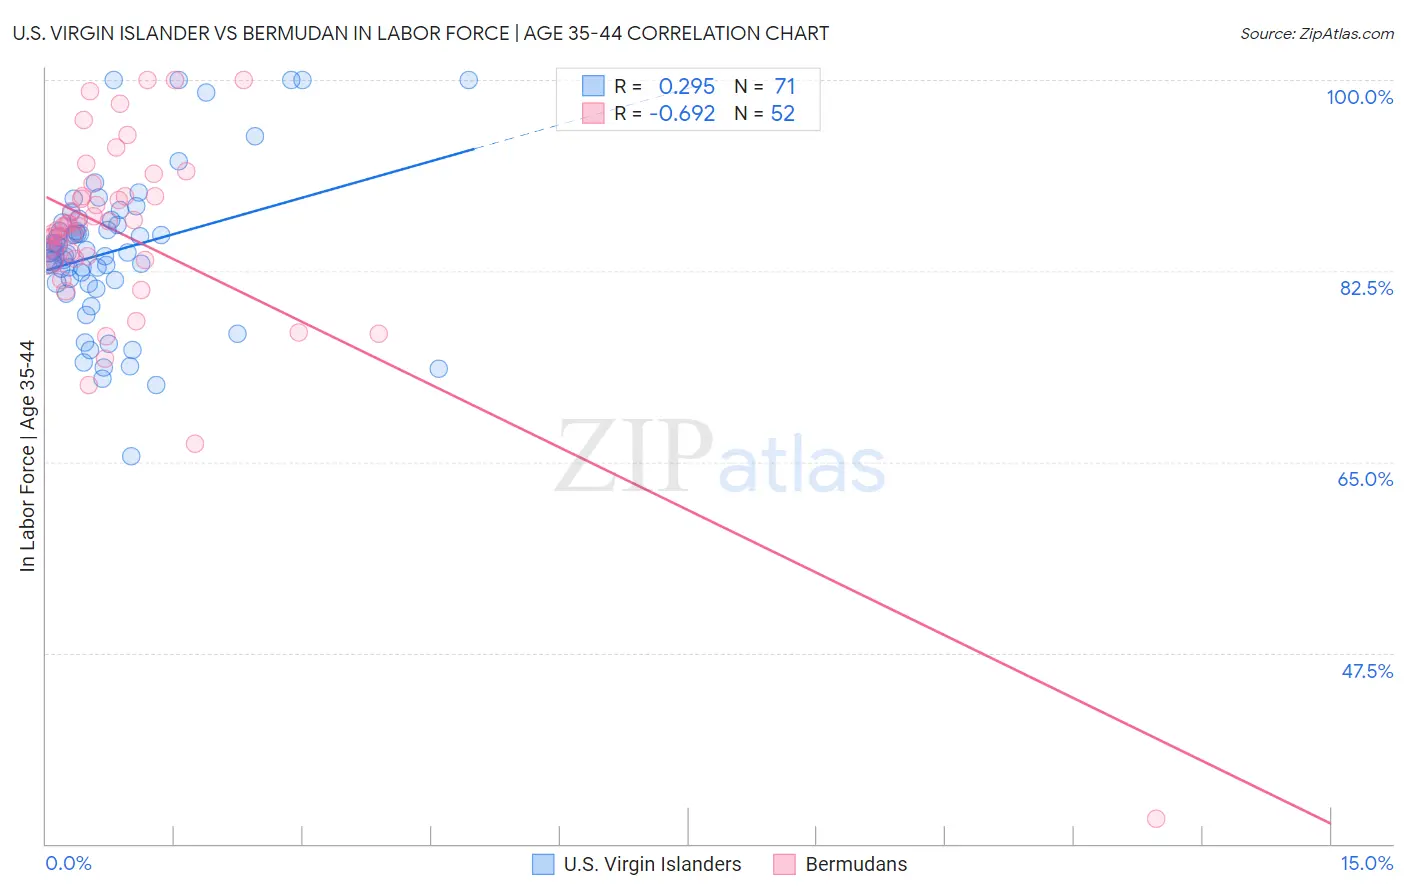
U.S. Virgin Islander vs Bermudan In Labor Force | Age 35-44 Correlation Chart

The statistical analysis conducted on geographies consisting of 87,507,209 people shows a weak positive correlation between the proportion of U.S. Virgin Islanders and labor force participation rate among population between the ages 35 and 44 in the United States with a correlation coefficient (R) of 0.295 and weighted average of 84.0%. Similarly, the statistical analysis conducted on geographies consisting of 55,725,453 people shows a significant negative correlation between the proportion of Bermudans and labor force participation rate among population between the ages 35 and 44 in the United States with a correlation coefficient (R) of -0.692 and weighted average of 85.3%, a difference of 1.6%.
U.S. Virgin Islander vs Bermudan In Labor Force | Age 35-44

In Labor Force | Age 35-44 Correlation Summary

MeasurementU.S. Virgin IslanderBermudan
Minimum65.5%32.3%
Maximum100.0%100.0%
Range34.5%67.7%
Mean84.3%85.6%
Median84.2%86.6%
Interquartile 25% (IQ1)81.4%83.6%
Interquartile 75% (IQ3)87.0%89.4%
Interquartile Range (IQR)5.6%5.8%
Standard Deviation (Sample)7.0%10.2%
Standard Deviation (Population)6.9%10.1%

Similar Demographics by In Labor Force | Age 35-44

Demographics Similar to U.S. Virgin Islanders by In Labor Force | Age 35-44

In terms of in labor force | age 35-44, the demographic groups most similar to U.S. Virgin Islanders are Immigrants from Burma/Myanmar (84.0%, a difference of 0.0%), Assyrian/Chaldean/Syriac (84.0%, a difference of 0.010%), Immigrants from Panama (84.0%, a difference of 0.010%), Icelander (84.0%, a difference of 0.020%), and Panamanian (84.0%, a difference of 0.020%).
DemographicsRating | RankIn Labor Force | Age 35-44
Immigrants | Norway
11.7
/100
|
#217
Poor
84.1%
Immigrants | Nicaragua
9.4
/100
|
#218
Tragic
84.1%
Sub-Saharan Africans
9.3
/100
|
#219
Tragic
84.1%
French
7.5
/100
|
#220
Tragic
84.0%
Icelanders
6.7
/100
|
#221
Tragic
84.0%
Assyrians/Chaldeans/Syriacs
6.6
/100
|
#222
Tragic
84.0%
Immigrants | Panama
6.4
/100
|
#223
Tragic
84.0%
U.S. Virgin Islanders
6.1
/100
|
#224
Tragic
84.0%
Immigrants | Burma/Myanmar
6.1
/100
|
#225
Tragic
84.0%
Panamanians
5.4
/100
|
#226
Tragic
84.0%
British West Indians
5.3
/100
|
#227
Tragic
84.0%
Welsh
5.3
/100
|
#228
Tragic
84.0%
Immigrants | Thailand
4.7
/100
|
#229
Tragic
84.0%
Immigrants | Iraq
3.7
/100
|
#230
Tragic
83.9%
Scottish
3.2
/100
|
#231
Tragic
83.9%

Demographics Similar to Bermudans by In Labor Force | Age 35-44

In terms of in labor force | age 35-44, the demographic groups most similar to Bermudans are Czech (85.3%, a difference of 0.0%), Immigrants from India (85.3%, a difference of 0.0%), Cambodian (85.3%, a difference of 0.010%), Ugandan (85.3%, a difference of 0.010%), and Immigrants from Nepal (85.3%, a difference of 0.040%).
DemographicsRating | RankIn Labor Force | Age 35-44
Immigrants | Eastern Africa
100.0
/100
|
#23
Exceptional
85.4%
Latvians
99.9
/100
|
#24
Exceptional
85.4%
Paraguayans
99.9
/100
|
#25
Exceptional
85.4%
Immigrants | Liberia
99.9
/100
|
#26
Exceptional
85.4%
Immigrants | Lithuania
99.9
/100
|
#27
Exceptional
85.4%
Immigrants | Greece
99.9
/100
|
#28
Exceptional
85.3%
Cambodians
99.9
/100
|
#29
Exceptional
85.3%
Bermudans
99.9
/100
|
#30
Exceptional
85.3%
Czechs
99.9
/100
|
#31
Exceptional
85.3%
Immigrants | India
99.9
/100
|
#32
Exceptional
85.3%
Ugandans
99.9
/100
|
#33
Exceptional
85.3%
Immigrants | Nepal
99.9
/100
|
#34
Exceptional
85.3%
Estonians
99.9
/100
|
#35
Exceptional
85.3%
Immigrants | Morocco
99.8
/100
|
#36
Exceptional
85.2%
Kenyans
99.8
/100
|
#37
Exceptional
85.2%