U.S. Virgin Islander vs Bermudan Nursery School
COMPARE
U.S. Virgin Islander
Bermudan
Nursery School
Nursery School Comparison
U.S. Virgin Islanders
Bermudans
97.7%
NURSERY SCHOOL
2.1/ 100
METRIC RATING
233rd/ 347
METRIC RANK
98.0%
NURSERY SCHOOL
53.7/ 100
METRIC RATING
170th/ 347
METRIC RANK
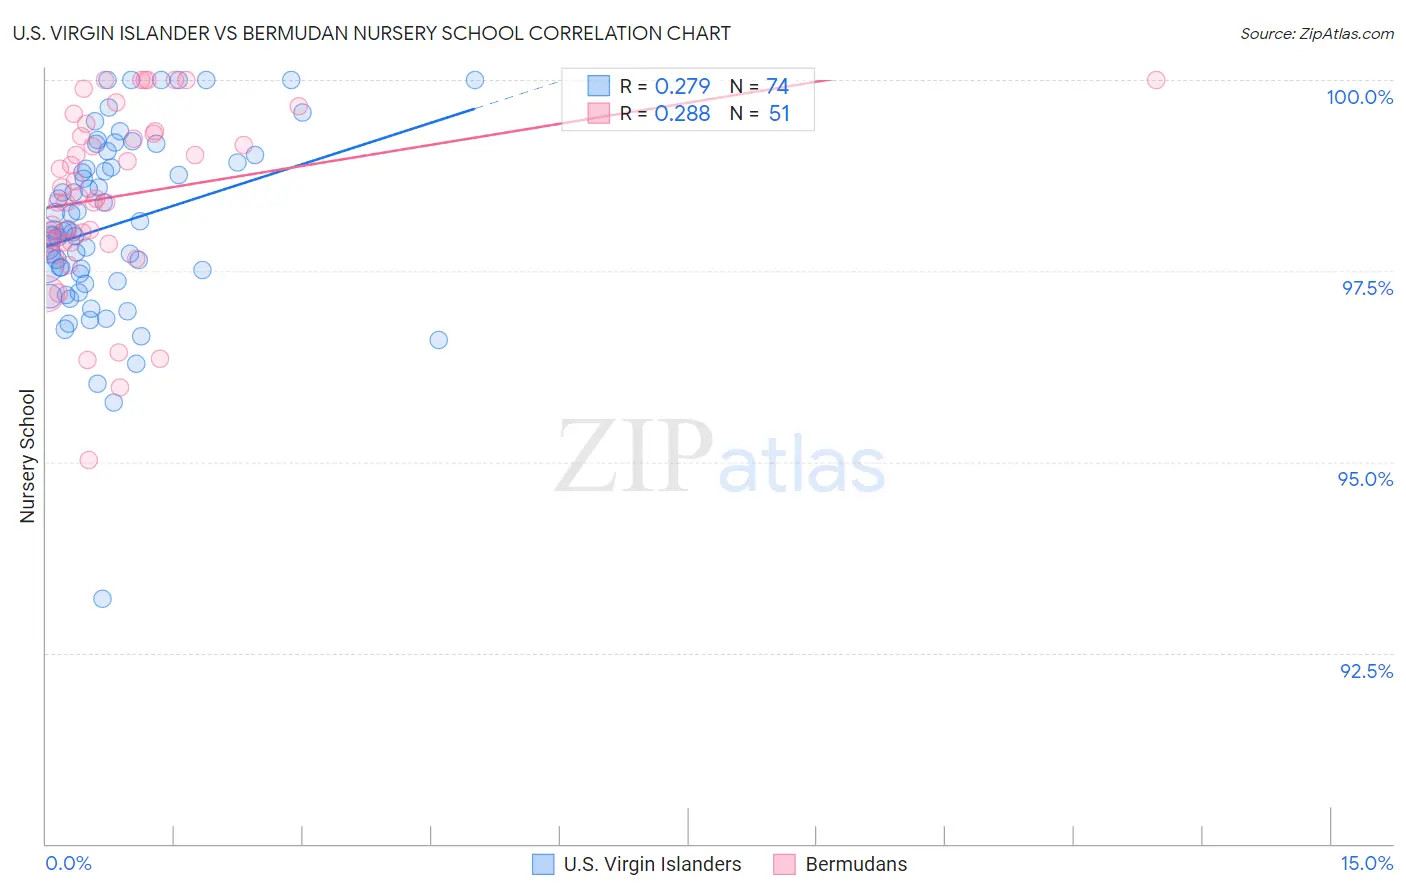
U.S. Virgin Islander vs Bermudan Nursery School Correlation Chart
The statistical analysis conducted on geographies consisting of 87,529,315 people shows a weak positive correlation between the proportion of U.S. Virgin Islanders and percentage of population with at least nursery school education in the United States with a correlation coefficient (R) of 0.279 and weighted average of 97.7%. Similarly, the statistical analysis conducted on geographies consisting of 55,721,975 people shows a weak positive correlation between the proportion of Bermudans and percentage of population with at least nursery school education in the United States with a correlation coefficient (R) of 0.288 and weighted average of 98.0%, a difference of 0.30%.
Nursery School Correlation Summary
| Measurement | U.S. Virgin Islander | Bermudan |
| Minimum | 93.2% | 95.0% |
| Maximum | 100.0% | 100.0% |
| Range | 6.8% | 5.0% |
| Mean | 98.1% | 98.5% |
| Median | 98.0% | 98.5% |
| Interquartile 25% (IQ1) | 97.5% | 97.9% |
| Interquartile 75% (IQ3) | 98.9% | 99.3% |
| Interquartile Range (IQR) | 1.4% | 1.5% |
| Standard Deviation (Sample) | 1.2% | 1.2% |
| Standard Deviation (Population) | 1.2% | 1.1% |
Similar Demographics by Nursery School
Demographics Similar to U.S. Virgin Islanders by Nursery School
In terms of nursery school, the demographic groups most similar to U.S. Virgin Islanders are Colombian (97.7%, a difference of 0.0%), Immigrants from Pakistan (97.7%, a difference of 0.0%), Puerto Rican (97.7%, a difference of 0.010%), Immigrants from Uruguay (97.7%, a difference of 0.010%), and Immigrants from Malaysia (97.7%, a difference of 0.010%).
| Demographics | Rating | Rank | Nursery School |
| Iraqis | 3.5 /100 | #226 | Tragic 97.7% |
| Sub-Saharan Africans | 3.2 /100 | #227 | Tragic 97.7% |
| Sudanese | 3.2 /100 | #228 | Tragic 97.7% |
| Senegalese | 3.2 /100 | #229 | Tragic 97.7% |
| Sierra Leoneans | 2.9 /100 | #230 | Tragic 97.7% |
| Puerto Ricans | 2.6 /100 | #231 | Tragic 97.7% |
| Immigrants | Uruguay | 2.3 /100 | #232 | Tragic 97.7% |
| U.S. Virgin Islanders | 2.1 /100 | #233 | Tragic 97.7% |
| Colombians | 2.1 /100 | #234 | Tragic 97.7% |
| Immigrants | Pakistan | 2.1 /100 | #235 | Tragic 97.7% |
| Immigrants | Malaysia | 1.9 /100 | #236 | Tragic 97.7% |
| Immigrants | Western Asia | 1.9 /100 | #237 | Tragic 97.7% |
| Nigerians | 1.7 /100 | #238 | Tragic 97.7% |
| Immigrants | Eastern Asia | 1.6 /100 | #239 | Tragic 97.7% |
| Koreans | 1.4 /100 | #240 | Tragic 97.7% |
Demographics Similar to Bermudans by Nursery School
In terms of nursery school, the demographic groups most similar to Bermudans are Immigrants from Micronesia (98.0%, a difference of 0.0%), Immigrants from Korea (98.0%, a difference of 0.0%), Immigrants from Jordan (98.0%, a difference of 0.0%), Ugandan (98.0%, a difference of 0.010%), and Chilean (98.0%, a difference of 0.010%).
| Demographics | Rating | Rank | Nursery School |
| Immigrants | Italy | 59.0 /100 | #163 | Average 98.0% |
| Ugandans | 56.4 /100 | #164 | Average 98.0% |
| Chileans | 56.4 /100 | #165 | Average 98.0% |
| Spanish Americans | 55.6 /100 | #166 | Average 98.0% |
| Immigrants | Spain | 55.6 /100 | #167 | Average 98.0% |
| Immigrants | Micronesia | 55.0 /100 | #168 | Average 98.0% |
| Immigrants | Korea | 53.8 /100 | #169 | Average 98.0% |
| Bermudans | 53.7 /100 | #170 | Average 98.0% |
| Immigrants | Jordan | 53.4 /100 | #171 | Average 98.0% |
| Immigrants | Brazil | 51.3 /100 | #172 | Average 98.0% |
| Kenyans | 50.2 /100 | #173 | Average 98.0% |
| Navajo | 50.0 /100 | #174 | Average 98.0% |
| Immigrants | Sri Lanka | 49.9 /100 | #175 | Average 98.0% |
| Immigrants | Venezuela | 49.8 /100 | #176 | Average 98.0% |
| Albanians | 48.9 /100 | #177 | Average 98.0% |