U.S. Virgin Islander vs Ute No Vehicles in Household
COMPARE
U.S. Virgin Islander
Ute
No Vehicles in Household
No Vehicles in Household Comparison
U.S. Virgin Islanders
Ute
15.4%
NO VEHICLES IN HOUSEHOLD
0.0/ 100
METRIC RATING
308th/ 347
METRIC RANK
11.6%
NO VEHICLES IN HOUSEHOLD
3.3/ 100
METRIC RATING
237th/ 347
METRIC RANK
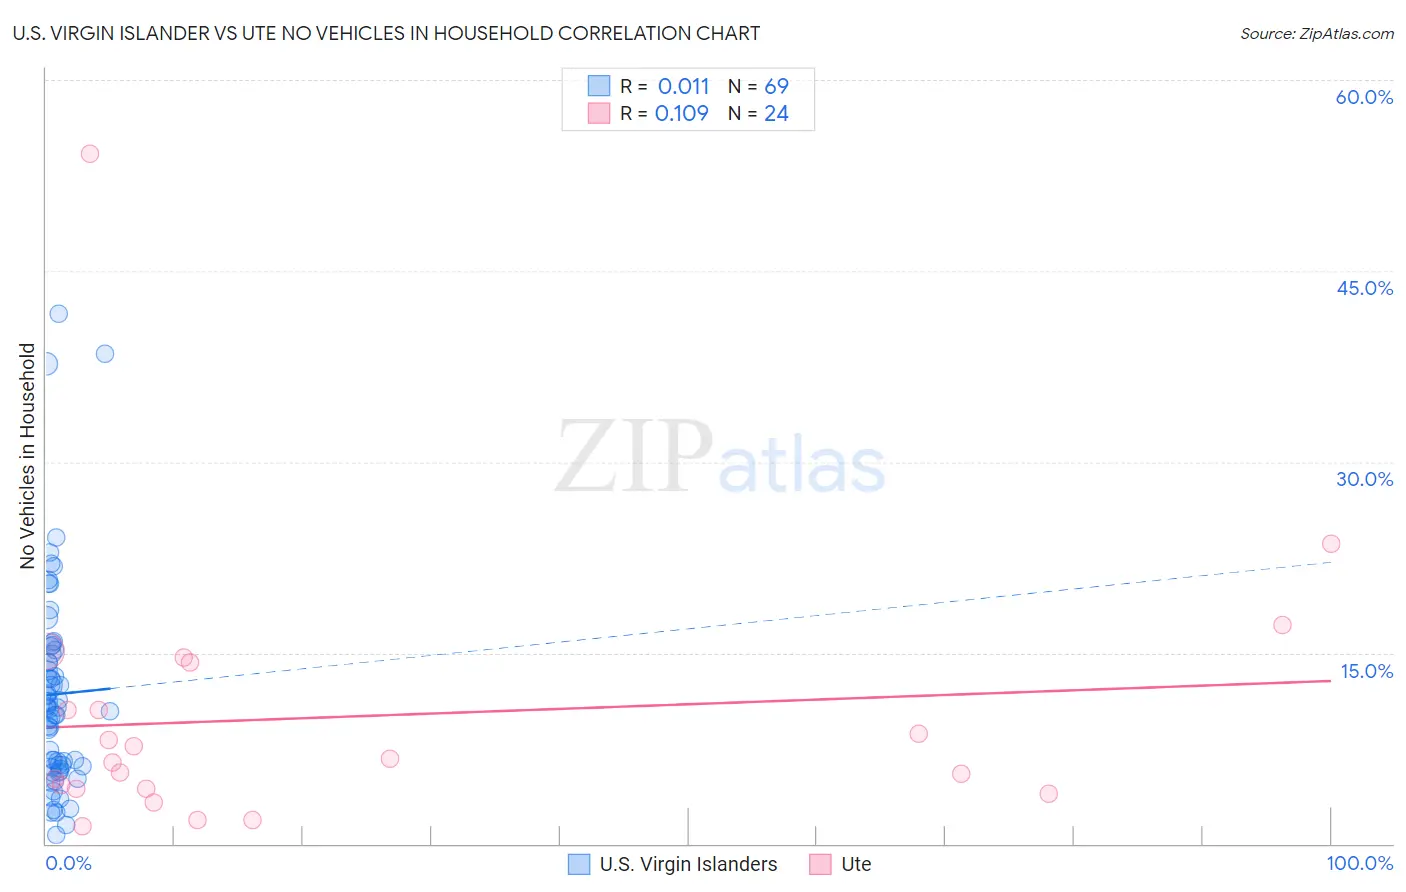
U.S. Virgin Islander vs Ute No Vehicles in Household Correlation Chart
The statistical analysis conducted on geographies consisting of 87,426,886 people shows no correlation between the proportion of U.S. Virgin Islanders and percentage of households with no vehicle available in the United States with a correlation coefficient (R) of 0.011 and weighted average of 15.4%. Similarly, the statistical analysis conducted on geographies consisting of 55,604,944 people shows a poor positive correlation between the proportion of Ute and percentage of households with no vehicle available in the United States with a correlation coefficient (R) of 0.109 and weighted average of 11.6%, a difference of 32.7%.
No Vehicles in Household Correlation Summary
| Measurement | U.S. Virgin Islander | Ute |
| Minimum | 0.71% | 1.3% |
| Maximum | 41.7% | 54.2% |
| Range | 41.0% | 52.9% |
| Mean | 11.7% | 10.0% |
| Median | 10.6% | 6.5% |
| Interquartile 25% (IQ1) | 6.0% | 4.3% |
| Interquartile 75% (IQ3) | 15.1% | 12.4% |
| Interquartile Range (IQR) | 9.1% | 8.1% |
| Standard Deviation (Sample) | 8.2% | 10.9% |
| Standard Deviation (Population) | 8.1% | 10.7% |
Similar Demographics by No Vehicles in Household
Demographics Similar to U.S. Virgin Islanders by No Vehicles in Household
In terms of no vehicles in household, the demographic groups most similar to U.S. Virgin Islanders are Immigrants from Haiti (15.4%, a difference of 0.030%), Immigrants from Belize (15.4%, a difference of 0.17%), Puerto Rican (15.5%, a difference of 0.65%), Cape Verdean (15.6%, a difference of 1.2%), and Immigrants from Israel (15.6%, a difference of 1.2%).
| Demographics | Rating | Rank | No Vehicles in Household |
| Immigrants | Ukraine | 0.0 /100 | #301 | Tragic 14.9% |
| Haitians | 0.0 /100 | #302 | Tragic 14.9% |
| Immigrants | Western Africa | 0.0 /100 | #303 | Tragic 15.0% |
| Immigrants | Russia | 0.0 /100 | #304 | Tragic 15.1% |
| Immigrants | China | 0.0 /100 | #305 | Tragic 15.2% |
| Immigrants | Belize | 0.0 /100 | #306 | Tragic 15.4% |
| Immigrants | Haiti | 0.0 /100 | #307 | Tragic 15.4% |
| U.S. Virgin Islanders | 0.0 /100 | #308 | Tragic 15.4% |
| Puerto Ricans | 0.0 /100 | #309 | Tragic 15.5% |
| Cape Verdeans | 0.0 /100 | #310 | Tragic 15.6% |
| Immigrants | Israel | 0.0 /100 | #311 | Tragic 15.6% |
| Alaskan Athabascans | 0.0 /100 | #312 | Tragic 15.6% |
| Tohono O'odham | 0.0 /100 | #313 | Tragic 15.6% |
| Albanians | 0.0 /100 | #314 | Tragic 15.6% |
| Cypriots | 0.0 /100 | #315 | Tragic 15.7% |
Demographics Similar to Ute by No Vehicles in Household
In terms of no vehicles in household, the demographic groups most similar to Ute are Russian (11.6%, a difference of 0.050%), Cree (11.6%, a difference of 0.24%), Taiwanese (11.7%, a difference of 0.51%), Immigrants (11.7%, a difference of 0.57%), and Eastern European (11.7%, a difference of 0.58%).
| Demographics | Rating | Rank | No Vehicles in Household |
| Immigrants | Norway | 5.1 /100 | #230 | Tragic 11.4% |
| Immigrants | Japan | 5.1 /100 | #231 | Tragic 11.4% |
| Immigrants | Turkey | 4.8 /100 | #232 | Tragic 11.5% |
| Houma | 4.7 /100 | #233 | Tragic 11.5% |
| Immigrants | Peru | 4.5 /100 | #234 | Tragic 11.5% |
| Kiowa | 4.0 /100 | #235 | Tragic 11.5% |
| Cree | 3.5 /100 | #236 | Tragic 11.6% |
| Ute | 3.3 /100 | #237 | Tragic 11.6% |
| Russians | 3.2 /100 | #238 | Tragic 11.6% |
| Taiwanese | 2.8 /100 | #239 | Tragic 11.7% |
| Immigrants | Immigrants | 2.7 /100 | #240 | Tragic 11.7% |
| Eastern Europeans | 2.7 /100 | #241 | Tragic 11.7% |
| Turks | 2.6 /100 | #242 | Tragic 11.7% |
| Cheyenne | 2.4 /100 | #243 | Tragic 11.7% |
| Immigrants | Portugal | 2.2 /100 | #244 | Tragic 11.7% |