Cape Verdean vs Russian 4 or more Vehicles in Household
COMPARE
Cape Verdean
Russian
4 or more Vehicles in Household
4 or more Vehicles in Household Comparison
Cape Verdeans
Russians
4.4%
4 OR MORE VEHICLES IN HOUSEHOLD
0.0/ 100
METRIC RATING
326th/ 347
METRIC RANK
6.0%
4 OR MORE VEHICLES IN HOUSEHOLD
10.3/ 100
METRIC RATING
220th/ 347
METRIC RANK
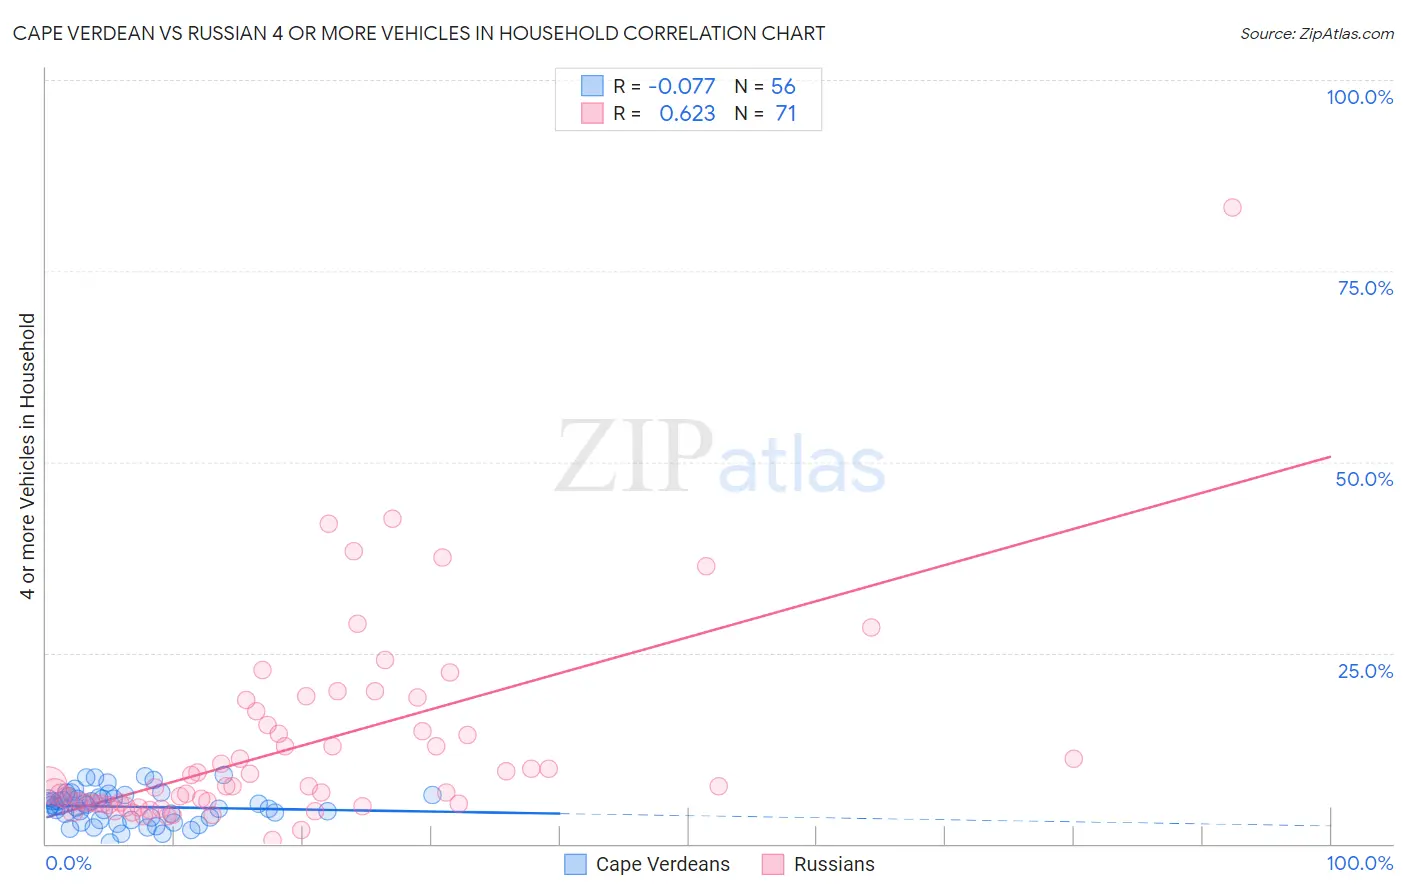
Cape Verdean vs Russian 4 or more Vehicles in Household Correlation Chart
The statistical analysis conducted on geographies consisting of 107,262,408 people shows a slight negative correlation between the proportion of Cape Verdeans and percentage of households with 4 or more vehicles available in the United States with a correlation coefficient (R) of -0.077 and weighted average of 4.4%. Similarly, the statistical analysis conducted on geographies consisting of 509,368,397 people shows a significant positive correlation between the proportion of Russians and percentage of households with 4 or more vehicles available in the United States with a correlation coefficient (R) of 0.623 and weighted average of 6.0%, a difference of 35.9%.
4 or more Vehicles in Household Correlation Summary
| Measurement | Cape Verdean | Russian |
| Minimum | 0.12% | 0.51% |
| Maximum | 9.0% | 83.3% |
| Range | 8.9% | 82.8% |
| Mean | 4.8% | 12.8% |
| Median | 4.9% | 7.5% |
| Interquartile 25% (IQ1) | 3.2% | 5.3% |
| Interquartile 75% (IQ3) | 6.1% | 15.6% |
| Interquartile Range (IQR) | 2.8% | 10.3% |
| Standard Deviation (Sample) | 2.1% | 13.0% |
| Standard Deviation (Population) | 2.1% | 12.9% |
Similar Demographics by 4 or more Vehicles in Household
Demographics Similar to Cape Verdeans by 4 or more Vehicles in Household
In terms of 4 or more vehicles in household, the demographic groups most similar to Cape Verdeans are Immigrants from Jamaica (4.4%, a difference of 0.32%), Soviet Union (4.4%, a difference of 0.64%), Immigrants from Caribbean (4.4%, a difference of 0.92%), Immigrants from Yemen (4.5%, a difference of 1.3%), and Ecuadorian (4.5%, a difference of 1.5%).
| Demographics | Rating | Rank | 4 or more Vehicles in Household |
| Haitians | 0.0 /100 | #319 | Tragic 4.6% |
| Immigrants | Haiti | 0.0 /100 | #320 | Tragic 4.5% |
| Ecuadorians | 0.0 /100 | #321 | Tragic 4.5% |
| Immigrants | Yemen | 0.0 /100 | #322 | Tragic 4.5% |
| Immigrants | Caribbean | 0.0 /100 | #323 | Tragic 4.4% |
| Soviet Union | 0.0 /100 | #324 | Tragic 4.4% |
| Immigrants | Jamaica | 0.0 /100 | #325 | Tragic 4.4% |
| Cape Verdeans | 0.0 /100 | #326 | Tragic 4.4% |
| Senegalese | 0.0 /100 | #327 | Tragic 4.3% |
| Trinidadians and Tobagonians | 0.0 /100 | #328 | Tragic 4.3% |
| Immigrants | Senegal | 0.0 /100 | #329 | Tragic 4.2% |
| Immigrants | Ecuador | 0.0 /100 | #330 | Tragic 4.2% |
| West Indians | 0.0 /100 | #331 | Tragic 4.2% |
| Immigrants | Dominica | 0.0 /100 | #332 | Tragic 4.2% |
| Immigrants | Albania | 0.0 /100 | #333 | Tragic 4.1% |
Demographics Similar to Russians by 4 or more Vehicles in Household
In terms of 4 or more vehicles in household, the demographic groups most similar to Russians are Immigrants from Italy (6.0%, a difference of 0.19%), Serbian (6.0%, a difference of 0.19%), Immigrants from Moldova (6.0%, a difference of 0.29%), Cajun (6.0%, a difference of 0.33%), and Immigrants from Kenya (6.0%, a difference of 0.33%).
| Demographics | Rating | Rank | 4 or more Vehicles in Household |
| Arabs | 14.4 /100 | #213 | Poor 6.0% |
| Immigrants | Austria | 14.3 /100 | #214 | Poor 6.0% |
| Immigrants | China | 13.8 /100 | #215 | Poor 6.0% |
| Immigrants | Romania | 13.8 /100 | #216 | Poor 6.0% |
| Nigerians | 12.2 /100 | #217 | Poor 6.0% |
| Immigrants | Italy | 11.0 /100 | #218 | Poor 6.0% |
| Serbians | 11.0 /100 | #219 | Poor 6.0% |
| Russians | 10.3 /100 | #220 | Poor 6.0% |
| Immigrants | Moldova | 9.3 /100 | #221 | Tragic 6.0% |
| Cajuns | 9.2 /100 | #222 | Tragic 6.0% |
| Immigrants | Kenya | 9.2 /100 | #223 | Tragic 6.0% |
| Cubans | 9.2 /100 | #224 | Tragic 6.0% |
| Indonesians | 8.9 /100 | #225 | Tragic 6.0% |
| Immigrants | Singapore | 7.9 /100 | #226 | Tragic 5.9% |
| Immigrants | Western Asia | 7.8 /100 | #227 | Tragic 5.9% |