Turkish vs Russian Unemployment Among Women with Children Under 6 years
COMPARE
Turkish
Russian
Unemployment Among Women with Children Under 6 years
Unemployment Among Women with Children Under 6 years Comparison
Turks
Russians
7.0%
UNEMPLOYMENT AMONG WOMEN WITH CHILDREN UNDER 6 YEARS
99.2/ 100
METRIC RATING
74th/ 347
METRIC RANK
7.2%
UNEMPLOYMENT AMONG WOMEN WITH CHILDREN UNDER 6 YEARS
97.5/ 100
METRIC RATING
98th/ 347
METRIC RANK
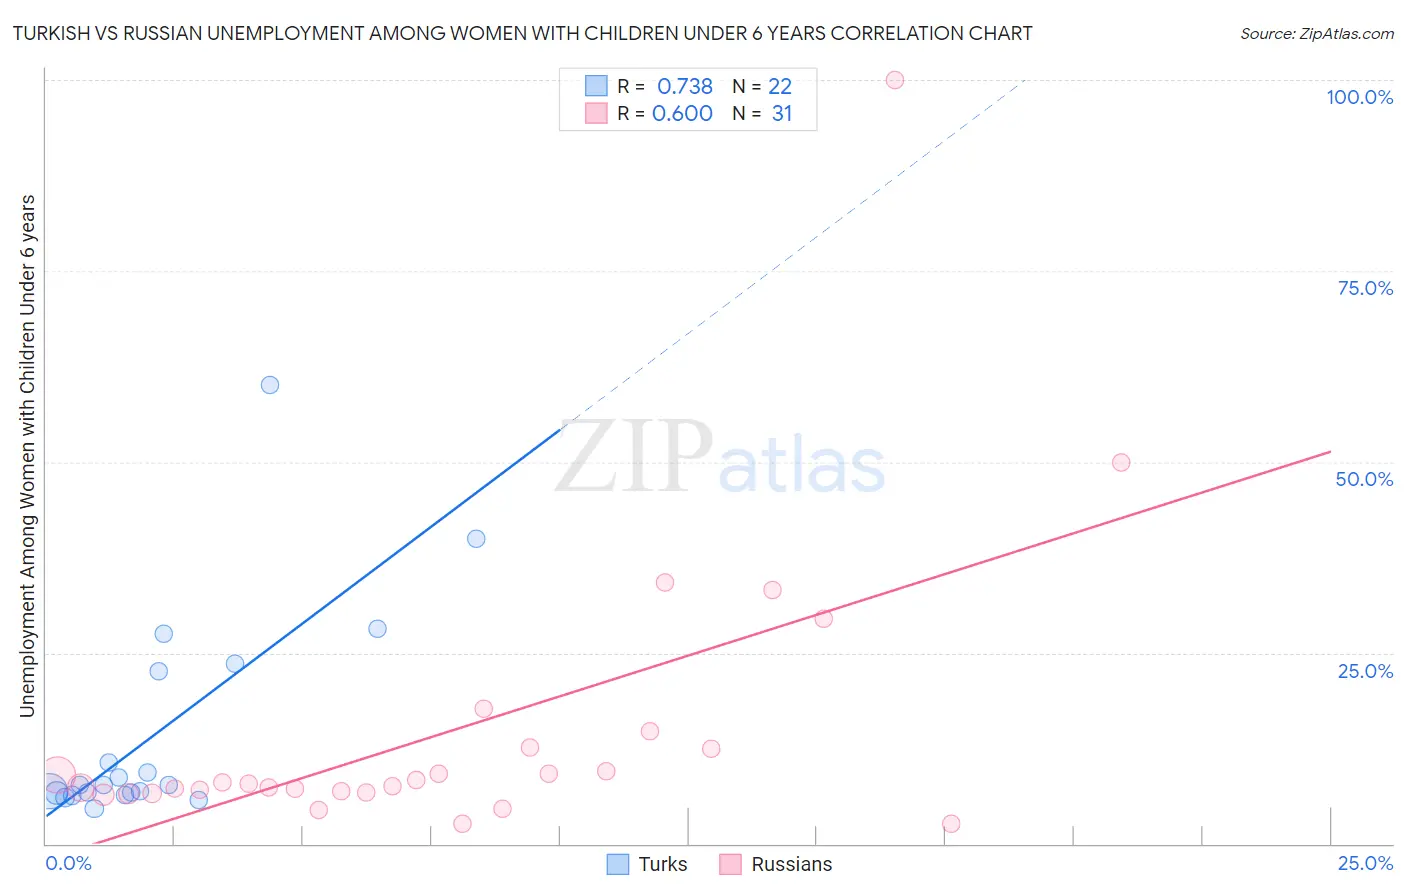
Turkish vs Russian Unemployment Among Women with Children Under 6 years Correlation Chart
The statistical analysis conducted on geographies consisting of 219,764,110 people shows a strong positive correlation between the proportion of Turks and unemployment rate among women with children under the age of 6 in the United States with a correlation coefficient (R) of 0.738 and weighted average of 7.0%. Similarly, the statistical analysis conducted on geographies consisting of 355,681,111 people shows a substantial positive correlation between the proportion of Russians and unemployment rate among women with children under the age of 6 in the United States with a correlation coefficient (R) of 0.600 and weighted average of 7.2%, a difference of 2.0%.
Unemployment Among Women with Children Under 6 years Correlation Summary
| Measurement | Turkish | Russian |
| Minimum | 4.6% | 2.6% |
| Maximum | 60.0% | 100.0% |
| Range | 55.4% | 97.4% |
| Mean | 14.4% | 14.7% |
| Median | 7.7% | 7.8% |
| Interquartile 25% (IQ1) | 6.6% | 6.7% |
| Interquartile 75% (IQ3) | 22.6% | 12.6% |
| Interquartile Range (IQR) | 16.0% | 5.9% |
| Standard Deviation (Sample) | 14.0% | 19.1% |
| Standard Deviation (Population) | 13.7% | 18.8% |
Similar Demographics by Unemployment Among Women with Children Under 6 years
Demographics Similar to Turks by Unemployment Among Women with Children Under 6 years
In terms of unemployment among women with children under 6 years, the demographic groups most similar to Turks are Immigrants from Czechoslovakia (7.0%, a difference of 0.010%), Immigrants from Eastern Europe (7.1%, a difference of 0.40%), Estonian (7.1%, a difference of 0.45%), Immigrants from Croatia (7.1%, a difference of 0.48%), and Immigrants from Somalia (7.1%, a difference of 0.52%).
| Demographics | Rating | Rank | Unemployment Among Women with Children Under 6 years |
| Immigrants | Netherlands | 99.5 /100 | #67 | Exceptional 7.0% |
| Paraguayans | 99.4 /100 | #68 | Exceptional 7.0% |
| Immigrants | Eritrea | 99.4 /100 | #69 | Exceptional 7.0% |
| Immigrants | Iraq | 99.4 /100 | #70 | Exceptional 7.0% |
| Afghans | 99.4 /100 | #71 | Exceptional 7.0% |
| Cubans | 99.4 /100 | #72 | Exceptional 7.0% |
| Immigrants | Czechoslovakia | 99.2 /100 | #73 | Exceptional 7.0% |
| Turks | 99.2 /100 | #74 | Exceptional 7.0% |
| Immigrants | Eastern Europe | 99.0 /100 | #75 | Exceptional 7.1% |
| Estonians | 99.0 /100 | #76 | Exceptional 7.1% |
| Immigrants | Croatia | 98.9 /100 | #77 | Exceptional 7.1% |
| Immigrants | Somalia | 98.9 /100 | #78 | Exceptional 7.1% |
| Immigrants | Fiji | 98.9 /100 | #79 | Exceptional 7.1% |
| Immigrants | Greece | 98.9 /100 | #80 | Exceptional 7.1% |
| Immigrants | Venezuela | 98.8 /100 | #81 | Exceptional 7.1% |
Demographics Similar to Russians by Unemployment Among Women with Children Under 6 years
In terms of unemployment among women with children under 6 years, the demographic groups most similar to Russians are Immigrants from South Eastern Asia (7.2%, a difference of 0.030%), Immigrants from Europe (7.2%, a difference of 0.040%), Immigrants from Northern Europe (7.2%, a difference of 0.080%), Immigrants from Eastern Africa (7.2%, a difference of 0.11%), and Chilean (7.2%, a difference of 0.11%).
| Demographics | Rating | Rank | Unemployment Among Women with Children Under 6 years |
| Danes | 98.2 /100 | #91 | Exceptional 7.1% |
| Albanians | 98.0 /100 | #92 | Exceptional 7.2% |
| New Zealanders | 97.8 /100 | #93 | Exceptional 7.2% |
| Macedonians | 97.7 /100 | #94 | Exceptional 7.2% |
| Romanians | 97.7 /100 | #95 | Exceptional 7.2% |
| Immigrants | Eastern Africa | 97.7 /100 | #96 | Exceptional 7.2% |
| Immigrants | South Eastern Asia | 97.6 /100 | #97 | Exceptional 7.2% |
| Russians | 97.5 /100 | #98 | Exceptional 7.2% |
| Immigrants | Europe | 97.5 /100 | #99 | Exceptional 7.2% |
| Immigrants | Northern Europe | 97.4 /100 | #100 | Exceptional 7.2% |
| Chileans | 97.4 /100 | #101 | Exceptional 7.2% |
| Immigrants | Nicaragua | 97.3 /100 | #102 | Exceptional 7.2% |
| Immigrants | Saudi Arabia | 97.3 /100 | #103 | Exceptional 7.2% |
| Immigrants | Egypt | 97.2 /100 | #104 | Exceptional 7.2% |
| Venezuelans | 97.2 /100 | #105 | Exceptional 7.2% |