Immigrants from Spain vs Russian 4 or more Vehicles in Household
COMPARE
Immigrants from Spain
Russian
4 or more Vehicles in Household
4 or more Vehicles in Household Comparison
Immigrants from Spain
Russians
5.4%
4 OR MORE VEHICLES IN HOUSEHOLD
0.3/ 100
METRIC RATING
282nd/ 347
METRIC RANK
6.0%
4 OR MORE VEHICLES IN HOUSEHOLD
10.3/ 100
METRIC RATING
220th/ 347
METRIC RANK
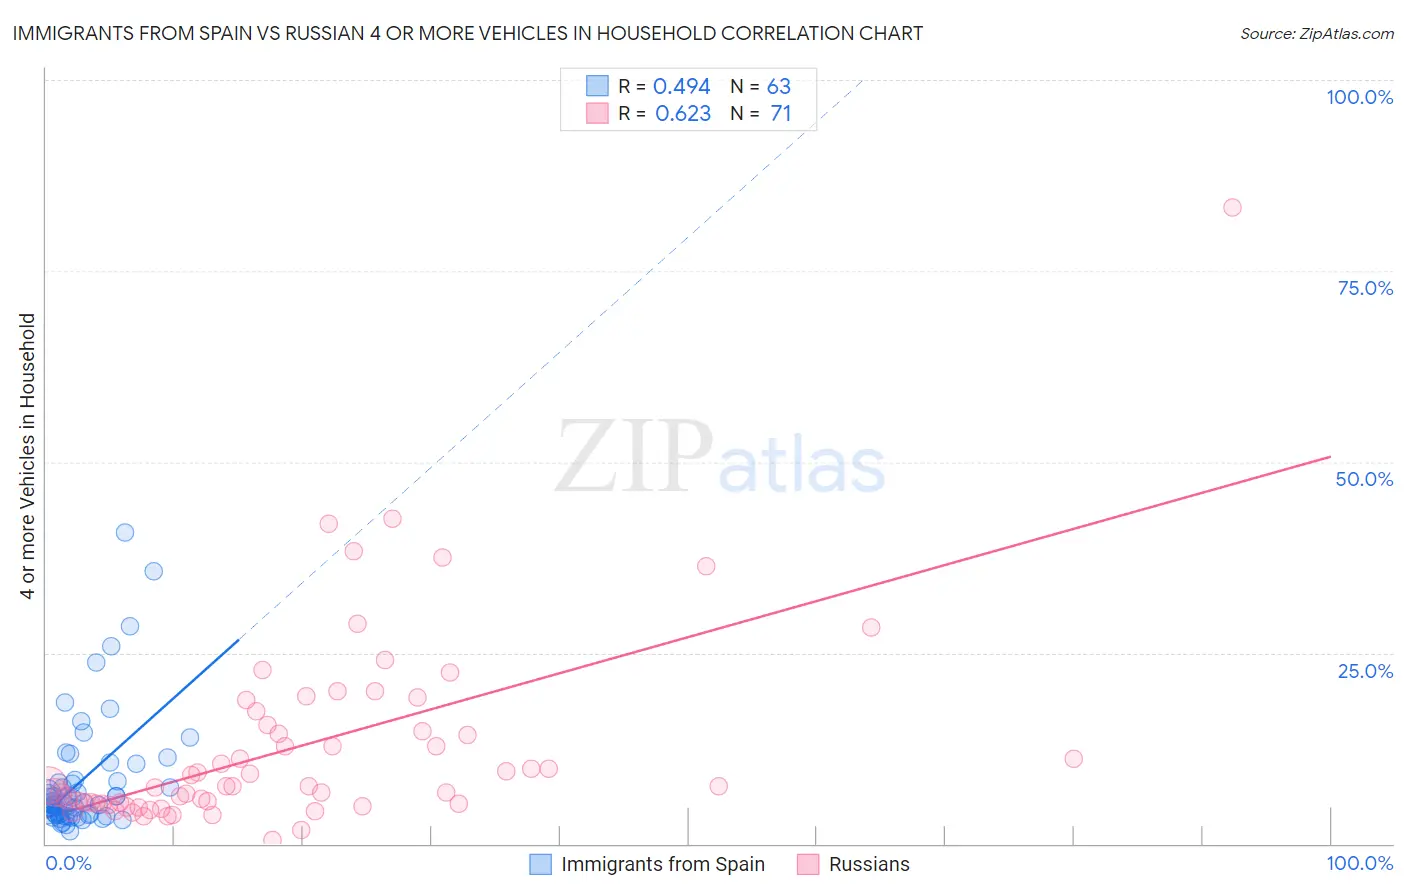
Immigrants from Spain vs Russian 4 or more Vehicles in Household Correlation Chart
The statistical analysis conducted on geographies consisting of 238,415,926 people shows a moderate positive correlation between the proportion of Immigrants from Spain and percentage of households with 4 or more vehicles available in the United States with a correlation coefficient (R) of 0.494 and weighted average of 5.4%. Similarly, the statistical analysis conducted on geographies consisting of 509,368,397 people shows a significant positive correlation between the proportion of Russians and percentage of households with 4 or more vehicles available in the United States with a correlation coefficient (R) of 0.623 and weighted average of 6.0%, a difference of 10.8%.
4 or more Vehicles in Household Correlation Summary
| Measurement | Immigrants from Spain | Russian |
| Minimum | 1.7% | 0.51% |
| Maximum | 40.8% | 83.3% |
| Range | 39.1% | 82.8% |
| Mean | 8.4% | 12.8% |
| Median | 5.4% | 7.5% |
| Interquartile 25% (IQ1) | 3.7% | 5.3% |
| Interquartile 75% (IQ3) | 8.4% | 15.6% |
| Interquartile Range (IQR) | 4.7% | 10.3% |
| Standard Deviation (Sample) | 7.8% | 13.0% |
| Standard Deviation (Population) | 7.8% | 12.9% |
Similar Demographics by 4 or more Vehicles in Household
Demographics Similar to Immigrants from Spain by 4 or more Vehicles in Household
In terms of 4 or more vehicles in household, the demographic groups most similar to Immigrants from Spain are Immigrants from Ireland (5.4%, a difference of 0.080%), Immigrants from Western Africa (5.4%, a difference of 0.17%), Alsatian (5.4%, a difference of 0.24%), Immigrants from Uruguay (5.4%, a difference of 0.25%), and Brazilian (5.4%, a difference of 0.37%).
| Demographics | Rating | Rank | 4 or more Vehicles in Household |
| Cambodians | 0.5 /100 | #275 | Tragic 5.5% |
| Immigrants | Latvia | 0.5 /100 | #276 | Tragic 5.5% |
| Immigrants | Bulgaria | 0.5 /100 | #277 | Tragic 5.5% |
| Immigrants | Eastern Europe | 0.4 /100 | #278 | Tragic 5.4% |
| Immigrants | Uruguay | 0.3 /100 | #279 | Tragic 5.4% |
| Alsatians | 0.3 /100 | #280 | Tragic 5.4% |
| Immigrants | Western Africa | 0.3 /100 | #281 | Tragic 5.4% |
| Immigrants | Spain | 0.3 /100 | #282 | Tragic 5.4% |
| Immigrants | Ireland | 0.3 /100 | #283 | Tragic 5.4% |
| Brazilians | 0.3 /100 | #284 | Tragic 5.4% |
| Immigrants | Liberia | 0.2 /100 | #285 | Tragic 5.4% |
| Immigrants | Colombia | 0.2 /100 | #286 | Tragic 5.4% |
| Immigrants | Croatia | 0.2 /100 | #287 | Tragic 5.4% |
| Venezuelans | 0.2 /100 | #288 | Tragic 5.3% |
| Immigrants | Bosnia and Herzegovina | 0.2 /100 | #289 | Tragic 5.3% |
Demographics Similar to Russians by 4 or more Vehicles in Household
In terms of 4 or more vehicles in household, the demographic groups most similar to Russians are Immigrants from Italy (6.0%, a difference of 0.19%), Serbian (6.0%, a difference of 0.19%), Immigrants from Moldova (6.0%, a difference of 0.29%), Cajun (6.0%, a difference of 0.33%), and Immigrants from Kenya (6.0%, a difference of 0.33%).
| Demographics | Rating | Rank | 4 or more Vehicles in Household |
| Arabs | 14.4 /100 | #213 | Poor 6.0% |
| Immigrants | Austria | 14.3 /100 | #214 | Poor 6.0% |
| Immigrants | China | 13.8 /100 | #215 | Poor 6.0% |
| Immigrants | Romania | 13.8 /100 | #216 | Poor 6.0% |
| Nigerians | 12.2 /100 | #217 | Poor 6.0% |
| Immigrants | Italy | 11.0 /100 | #218 | Poor 6.0% |
| Serbians | 11.0 /100 | #219 | Poor 6.0% |
| Russians | 10.3 /100 | #220 | Poor 6.0% |
| Immigrants | Moldova | 9.3 /100 | #221 | Tragic 6.0% |
| Cajuns | 9.2 /100 | #222 | Tragic 6.0% |
| Immigrants | Kenya | 9.2 /100 | #223 | Tragic 6.0% |
| Cubans | 9.2 /100 | #224 | Tragic 6.0% |
| Indonesians | 8.9 /100 | #225 | Tragic 6.0% |
| Immigrants | Singapore | 7.9 /100 | #226 | Tragic 5.9% |
| Immigrants | Western Asia | 7.8 /100 | #227 | Tragic 5.9% |