Turkish vs Russian 10th Grade
COMPARE
Turkish
Russian
10th Grade
10th Grade Comparison
Turks
Russians
95.0%
10TH GRADE
99.7/ 100
METRIC RATING
65th/ 347
METRIC RANK
95.2%
10TH GRADE
99.9/ 100
METRIC RATING
41st/ 347
METRIC RANK
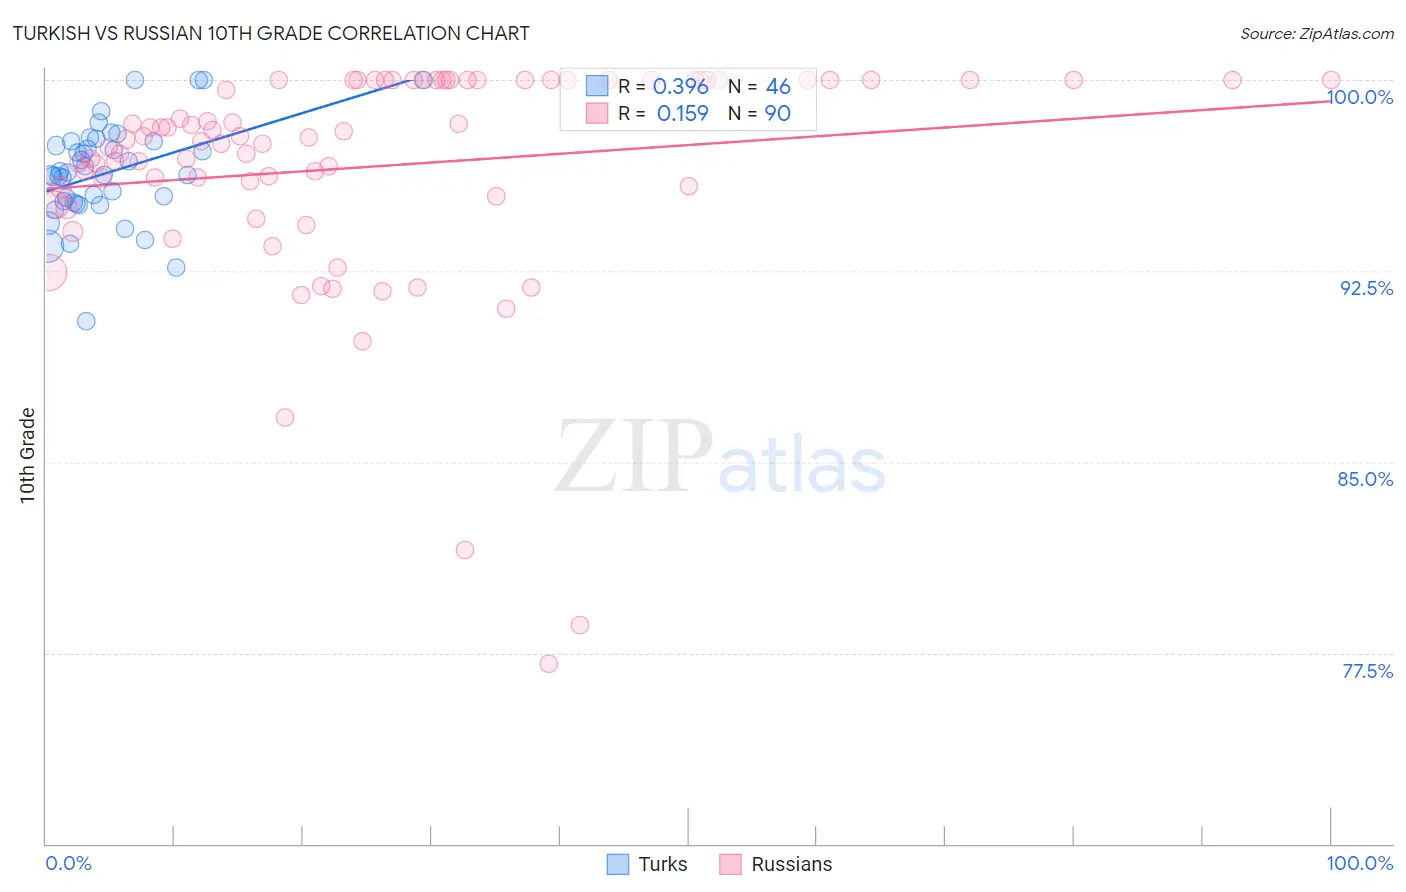
Turkish vs Russian 10th Grade Correlation Chart
The statistical analysis conducted on geographies consisting of 271,830,524 people shows a mild positive correlation between the proportion of Turks and percentage of population with at least 10th grade education in the United States with a correlation coefficient (R) of 0.396 and weighted average of 95.0%. Similarly, the statistical analysis conducted on geographies consisting of 512,259,033 people shows a poor positive correlation between the proportion of Russians and percentage of population with at least 10th grade education in the United States with a correlation coefficient (R) of 0.159 and weighted average of 95.2%, a difference of 0.25%.
10th Grade Correlation Summary
| Measurement | Turkish | Russian |
| Minimum | 90.5% | 77.1% |
| Maximum | 100.0% | 100.0% |
| Range | 9.5% | 22.9% |
| Mean | 96.4% | 96.6% |
| Median | 96.3% | 97.7% |
| Interquartile 25% (IQ1) | 95.2% | 95.8% |
| Interquartile 75% (IQ3) | 97.6% | 100.0% |
| Interquartile Range (IQR) | 2.4% | 4.2% |
| Standard Deviation (Sample) | 2.0% | 4.4% |
| Standard Deviation (Population) | 1.9% | 4.4% |
Similar Demographics by 10th Grade
Demographics Similar to Turks by 10th Grade
In terms of 10th grade, the demographic groups most similar to Turks are Native Hawaiian (95.0%, a difference of 0.010%), Immigrants from Singapore (95.0%, a difference of 0.020%), Cypriot (95.0%, a difference of 0.030%), Chippewa (95.0%, a difference of 0.030%), and Thai (95.0%, a difference of 0.030%).
| Demographics | Rating | Rank | 10th Grade |
| Aleuts | 99.8 /100 | #58 | Exceptional 95.0% |
| Celtics | 99.8 /100 | #59 | Exceptional 95.0% |
| Cypriots | 99.8 /100 | #60 | Exceptional 95.0% |
| Chippewa | 99.8 /100 | #61 | Exceptional 95.0% |
| Thais | 99.8 /100 | #62 | Exceptional 95.0% |
| Immigrants | Singapore | 99.8 /100 | #63 | Exceptional 95.0% |
| Native Hawaiians | 99.7 /100 | #64 | Exceptional 95.0% |
| Turks | 99.7 /100 | #65 | Exceptional 95.0% |
| Immigrants | Australia | 99.7 /100 | #66 | Exceptional 94.9% |
| Immigrants | Netherlands | 99.7 /100 | #67 | Exceptional 94.9% |
| Immigrants | Belgium | 99.7 /100 | #68 | Exceptional 94.9% |
| Immigrants | England | 99.6 /100 | #69 | Exceptional 94.9% |
| Zimbabweans | 99.6 /100 | #70 | Exceptional 94.9% |
| Alaska Natives | 99.6 /100 | #71 | Exceptional 94.9% |
| Immigrants | Sweden | 99.6 /100 | #72 | Exceptional 94.9% |
Demographics Similar to Russians by 10th Grade
In terms of 10th grade, the demographic groups most similar to Russians are Scotch-Irish (95.2%, a difference of 0.020%), Immigrants from Scotland (95.2%, a difference of 0.030%), Slavic (95.2%, a difference of 0.030%), Northern European (95.3%, a difference of 0.050%), and Macedonian (95.2%, a difference of 0.050%).
| Demographics | Rating | Rank | 10th Grade |
| British | 99.9 /100 | #34 | Exceptional 95.3% |
| Estonians | 99.9 /100 | #35 | Exceptional 95.3% |
| Immigrants | India | 99.9 /100 | #36 | Exceptional 95.3% |
| French Canadians | 99.9 /100 | #37 | Exceptional 95.3% |
| Northern Europeans | 99.9 /100 | #38 | Exceptional 95.3% |
| Immigrants | Scotland | 99.9 /100 | #39 | Exceptional 95.2% |
| Scotch-Irish | 99.9 /100 | #40 | Exceptional 95.2% |
| Russians | 99.9 /100 | #41 | Exceptional 95.2% |
| Slavs | 99.9 /100 | #42 | Exceptional 95.2% |
| Macedonians | 99.9 /100 | #43 | Exceptional 95.2% |
| Immigrants | Northern Europe | 99.9 /100 | #44 | Exceptional 95.2% |
| Greeks | 99.9 /100 | #45 | Exceptional 95.2% |
| Czechoslovakians | 99.9 /100 | #46 | Exceptional 95.1% |
| Serbians | 99.9 /100 | #47 | Exceptional 95.1% |
| Australians | 99.9 /100 | #48 | Exceptional 95.1% |