Turkish vs Immigrants from Dominican Republic Cognitive Disability
COMPARE
Turkish
Immigrants from Dominican Republic
Cognitive Disability
Cognitive Disability Comparison
Turks
Immigrants from Dominican Republic
16.9%
COGNITIVE DISABILITY
94.5/ 100
METRIC RATING
124th/ 347
METRIC RANK
18.8%
COGNITIVE DISABILITY
0.0/ 100
METRIC RATING
330th/ 347
METRIC RANK
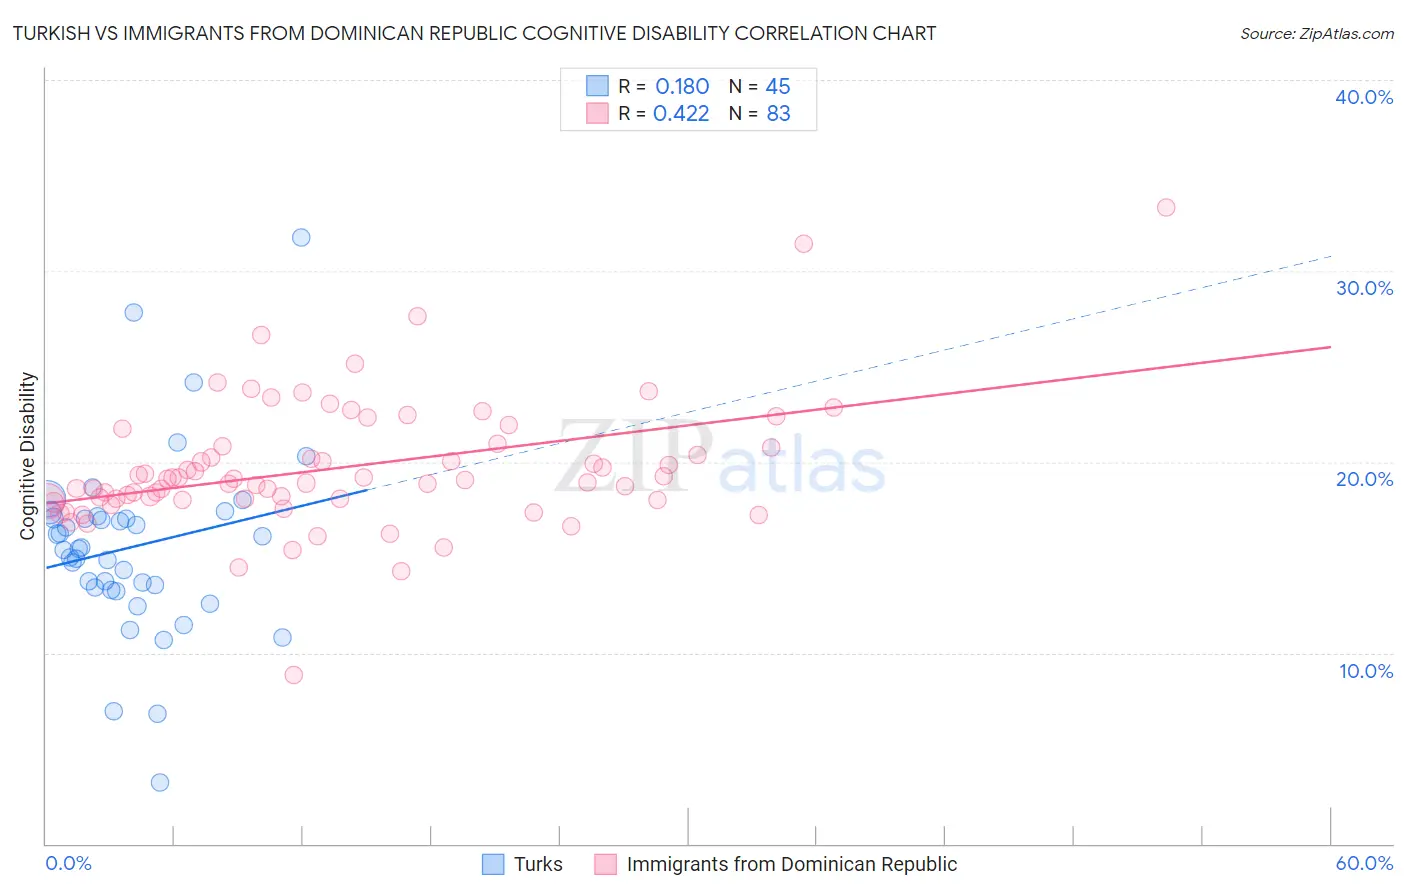
Turkish vs Immigrants from Dominican Republic Cognitive Disability Correlation Chart
The statistical analysis conducted on geographies consisting of 271,856,342 people shows a poor positive correlation between the proportion of Turks and percentage of population with cognitive disability in the United States with a correlation coefficient (R) of 0.180 and weighted average of 16.9%. Similarly, the statistical analysis conducted on geographies consisting of 275,093,930 people shows a moderate positive correlation between the proportion of Immigrants from Dominican Republic and percentage of population with cognitive disability in the United States with a correlation coefficient (R) of 0.422 and weighted average of 18.8%, a difference of 10.9%.
Cognitive Disability Correlation Summary
| Measurement | Turkish | Immigrants from Dominican Republic |
| Minimum | 3.2% | 8.8% |
| Maximum | 31.8% | 33.3% |
| Range | 28.5% | 24.5% |
| Mean | 15.5% | 19.7% |
| Median | 15.5% | 19.1% |
| Interquartile 25% (IQ1) | 13.4% | 18.0% |
| Interquartile 75% (IQ3) | 17.1% | 20.8% |
| Interquartile Range (IQR) | 3.8% | 2.8% |
| Standard Deviation (Sample) | 4.8% | 3.4% |
| Standard Deviation (Population) | 4.8% | 3.4% |
Similar Demographics by Cognitive Disability
Demographics Similar to Turks by Cognitive Disability
In terms of cognitive disability, the demographic groups most similar to Turks are Portuguese (16.9%, a difference of 0.020%), Immigrants from Western Europe (16.9%, a difference of 0.030%), Immigrants from China (16.9%, a difference of 0.050%), Scandinavian (16.9%, a difference of 0.050%), and Scottish (16.9%, a difference of 0.070%).
| Demographics | Rating | Rank | Cognitive Disability |
| Immigrants | Japan | 96.2 /100 | #117 | Exceptional 16.9% |
| Immigrants | Denmark | 96.2 /100 | #118 | Exceptional 16.9% |
| South Africans | 95.5 /100 | #119 | Exceptional 16.9% |
| Scottish | 95.0 /100 | #120 | Exceptional 16.9% |
| Immigrants | China | 94.9 /100 | #121 | Exceptional 16.9% |
| Immigrants | Western Europe | 94.8 /100 | #122 | Exceptional 16.9% |
| Portuguese | 94.7 /100 | #123 | Exceptional 16.9% |
| Turks | 94.5 /100 | #124 | Exceptional 16.9% |
| Scandinavians | 94.1 /100 | #125 | Exceptional 16.9% |
| Europeans | 93.4 /100 | #126 | Exceptional 17.0% |
| Immigrants | Costa Rica | 93.1 /100 | #127 | Exceptional 17.0% |
| Nicaraguans | 93.0 /100 | #128 | Exceptional 17.0% |
| Immigrants | Uruguay | 92.9 /100 | #129 | Exceptional 17.0% |
| Immigrants | Vietnam | 92.4 /100 | #130 | Exceptional 17.0% |
| Immigrants | Germany | 92.1 /100 | #131 | Exceptional 17.0% |
Demographics Similar to Immigrants from Dominican Republic by Cognitive Disability
In terms of cognitive disability, the demographic groups most similar to Immigrants from Dominican Republic are Pima (18.8%, a difference of 0.070%), Immigrants from Sudan (18.8%, a difference of 0.080%), Navajo (18.8%, a difference of 0.10%), Immigrants from Yemen (18.8%, a difference of 0.14%), and Kiowa (18.7%, a difference of 0.32%).
| Demographics | Rating | Rank | Cognitive Disability |
| Pueblo | 0.0 /100 | #323 | Tragic 18.7% |
| Dominicans | 0.0 /100 | #324 | Tragic 18.7% |
| Indonesians | 0.0 /100 | #325 | Tragic 18.7% |
| Immigrants | Senegal | 0.0 /100 | #326 | Tragic 18.7% |
| U.S. Virgin Islanders | 0.0 /100 | #327 | Tragic 18.7% |
| Kiowa | 0.0 /100 | #328 | Tragic 18.7% |
| Navajo | 0.0 /100 | #329 | Tragic 18.8% |
| Immigrants | Dominican Republic | 0.0 /100 | #330 | Tragic 18.8% |
| Pima | 0.0 /100 | #331 | Tragic 18.8% |
| Immigrants | Sudan | 0.0 /100 | #332 | Tragic 18.8% |
| Immigrants | Yemen | 0.0 /100 | #333 | Tragic 18.8% |
| Sudanese | 0.0 /100 | #334 | Tragic 18.9% |
| Senegalese | 0.0 /100 | #335 | Tragic 19.0% |
| Blacks/African Americans | 0.0 /100 | #336 | Tragic 19.0% |
| Immigrants | Saudi Arabia | 0.0 /100 | #337 | Tragic 19.1% |