Creek vs Immigrants from Dominican Republic 2 or more Vehicles in Household
COMPARE
Creek
Immigrants from Dominican Republic
2 or more Vehicles in Household
2 or more Vehicles in Household Comparison
Creek
Immigrants from Dominican Republic
58.3%
2 OR MORE VEHICLES IN HOUSEHOLD
99.5/ 100
METRIC RATING
76th/ 347
METRIC RANK
33.2%
2 OR MORE VEHICLES IN HOUSEHOLD
0.0/ 100
METRIC RATING
345th/ 347
METRIC RANK
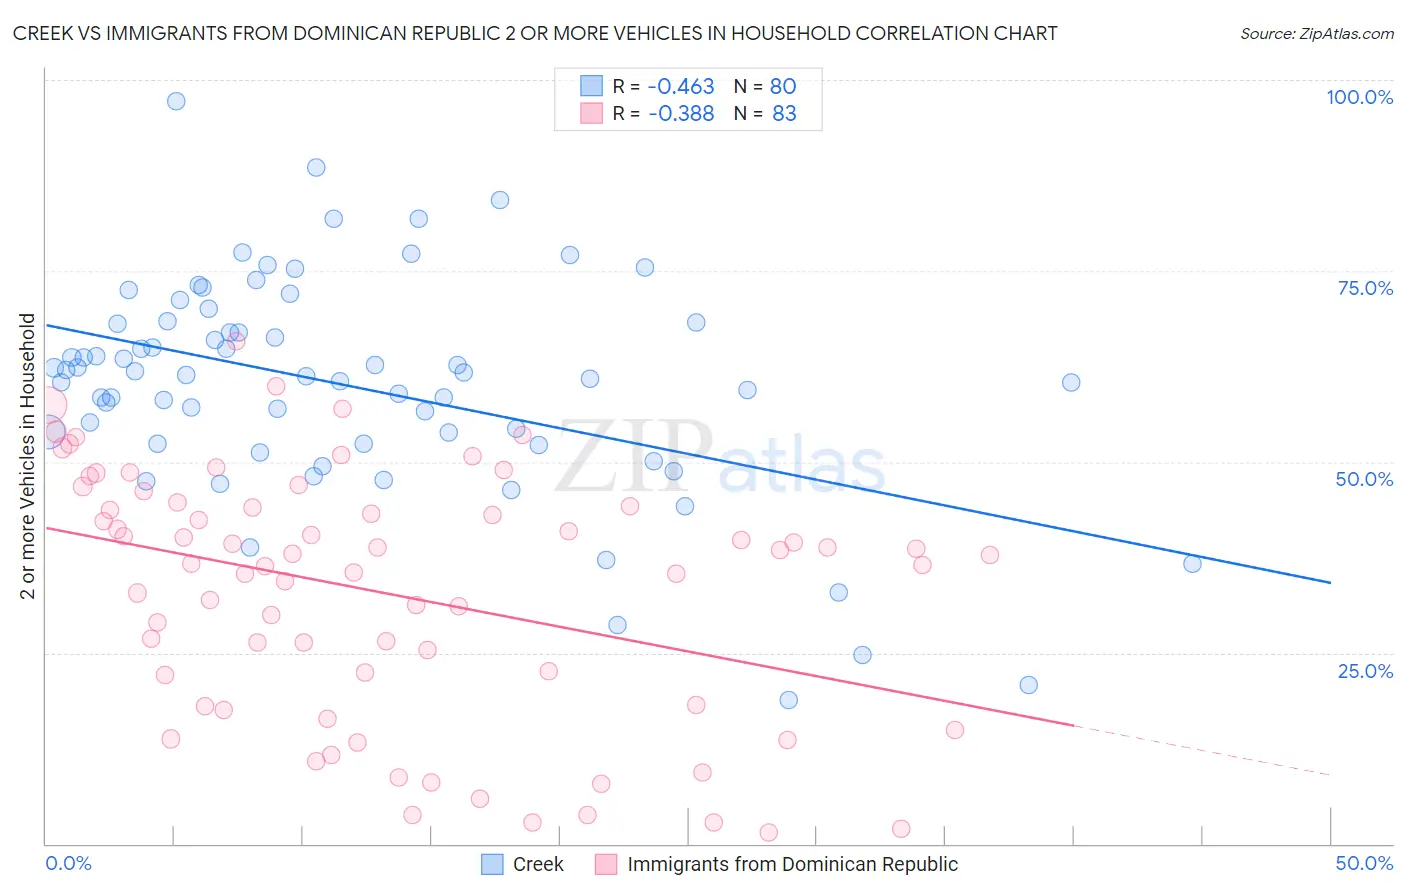
Creek vs Immigrants from Dominican Republic 2 or more Vehicles in Household Correlation Chart
The statistical analysis conducted on geographies consisting of 178,443,711 people shows a moderate negative correlation between the proportion of Creek and percentage of households with 2 or more vehicles available in the United States with a correlation coefficient (R) of -0.463 and weighted average of 58.3%. Similarly, the statistical analysis conducted on geographies consisting of 274,967,737 people shows a mild negative correlation between the proportion of Immigrants from Dominican Republic and percentage of households with 2 or more vehicles available in the United States with a correlation coefficient (R) of -0.388 and weighted average of 33.2%, a difference of 75.3%.
2 or more Vehicles in Household Correlation Summary
| Measurement | Creek | Immigrants from Dominican Republic |
| Minimum | 18.9% | 1.5% |
| Maximum | 97.2% | 65.8% |
| Range | 78.3% | 64.3% |
| Mean | 59.9% | 32.9% |
| Median | 61.3% | 36.6% |
| Interquartile 25% (IQ1) | 52.3% | 18.1% |
| Interquartile 75% (IQ3) | 68.2% | 44.2% |
| Interquartile Range (IQR) | 15.8% | 26.1% |
| Standard Deviation (Sample) | 14.4% | 16.2% |
| Standard Deviation (Population) | 14.4% | 16.1% |
Similar Demographics by 2 or more Vehicles in Household
Demographics Similar to Creek by 2 or more Vehicles in Household
In terms of 2 or more vehicles in household, the demographic groups most similar to Creek are Slovene (58.3%, a difference of 0.010%), Polish (58.3%, a difference of 0.030%), Lithuanian (58.2%, a difference of 0.060%), Immigrants from Afghanistan (58.3%, a difference of 0.11%), and Bolivian (58.3%, a difference of 0.12%).
| Demographics | Rating | Rank | 2 or more Vehicles in Household |
| Pennsylvania Germans | 99.7 /100 | #69 | Exceptional 58.5% |
| Italians | 99.6 /100 | #70 | Exceptional 58.4% |
| Bangladeshis | 99.6 /100 | #71 | Exceptional 58.4% |
| Austrians | 99.6 /100 | #72 | Exceptional 58.4% |
| Bolivians | 99.6 /100 | #73 | Exceptional 58.3% |
| Immigrants | Afghanistan | 99.6 /100 | #74 | Exceptional 58.3% |
| Poles | 99.5 /100 | #75 | Exceptional 58.3% |
| Creek | 99.5 /100 | #76 | Exceptional 58.3% |
| Slovenes | 99.5 /100 | #77 | Exceptional 58.3% |
| Lithuanians | 99.5 /100 | #78 | Exceptional 58.2% |
| Delaware | 99.4 /100 | #79 | Exceptional 58.2% |
| Immigrants | England | 99.3 /100 | #80 | Exceptional 58.1% |
| Immigrants | Iraq | 99.3 /100 | #81 | Exceptional 58.1% |
| Iranians | 99.3 /100 | #82 | Exceptional 58.1% |
| Icelanders | 99.2 /100 | #83 | Exceptional 58.0% |
Demographics Similar to Immigrants from Dominican Republic by 2 or more Vehicles in Household
In terms of 2 or more vehicles in household, the demographic groups most similar to Immigrants from Dominican Republic are Yup'ik (34.9%, a difference of 5.2%), Immigrants from Guyana (35.0%, a difference of 5.3%), Dominican (35.3%, a difference of 6.3%), Guyanese (35.4%, a difference of 6.5%), and British West Indian (35.4%, a difference of 6.5%).
| Demographics | Rating | Rank | 2 or more Vehicles in Household |
| Immigrants | Ecuador | 0.0 /100 | #333 | Tragic 40.5% |
| Immigrants | Trinidad and Tobago | 0.0 /100 | #334 | Tragic 40.3% |
| Immigrants | Bangladesh | 0.0 /100 | #335 | Tragic 38.8% |
| Vietnamese | 0.0 /100 | #336 | Tragic 38.5% |
| Barbadians | 0.0 /100 | #337 | Tragic 38.3% |
| Immigrants | Uzbekistan | 0.0 /100 | #338 | Tragic 37.9% |
| Immigrants | Barbados | 0.0 /100 | #339 | Tragic 35.8% |
| British West Indians | 0.0 /100 | #340 | Tragic 35.4% |
| Guyanese | 0.0 /100 | #341 | Tragic 35.4% |
| Dominicans | 0.0 /100 | #342 | Tragic 35.3% |
| Immigrants | Guyana | 0.0 /100 | #343 | Tragic 35.0% |
| Yup'ik | 0.0 /100 | #344 | Tragic 34.9% |
| Immigrants | Dominican Republic | 0.0 /100 | #345 | Tragic 33.2% |
| Immigrants | St. Vincent and the Grenadines | 0.0 /100 | #346 | Tragic 31.0% |
| Immigrants | Grenada | 0.0 /100 | #347 | Tragic 28.7% |