Turkish vs Immigrants from Dominican Republic Single Mother Poverty
COMPARE
Turkish
Immigrants from Dominican Republic
Single Mother Poverty
Single Mother Poverty Comparison
Turks
Immigrants from Dominican Republic
26.4%
SINGLE MOTHER POVERTY
100.0/ 100
METRIC RATING
30th/ 347
METRIC RANK
34.4%
SINGLE MOTHER POVERTY
0.0/ 100
METRIC RATING
313th/ 347
METRIC RANK
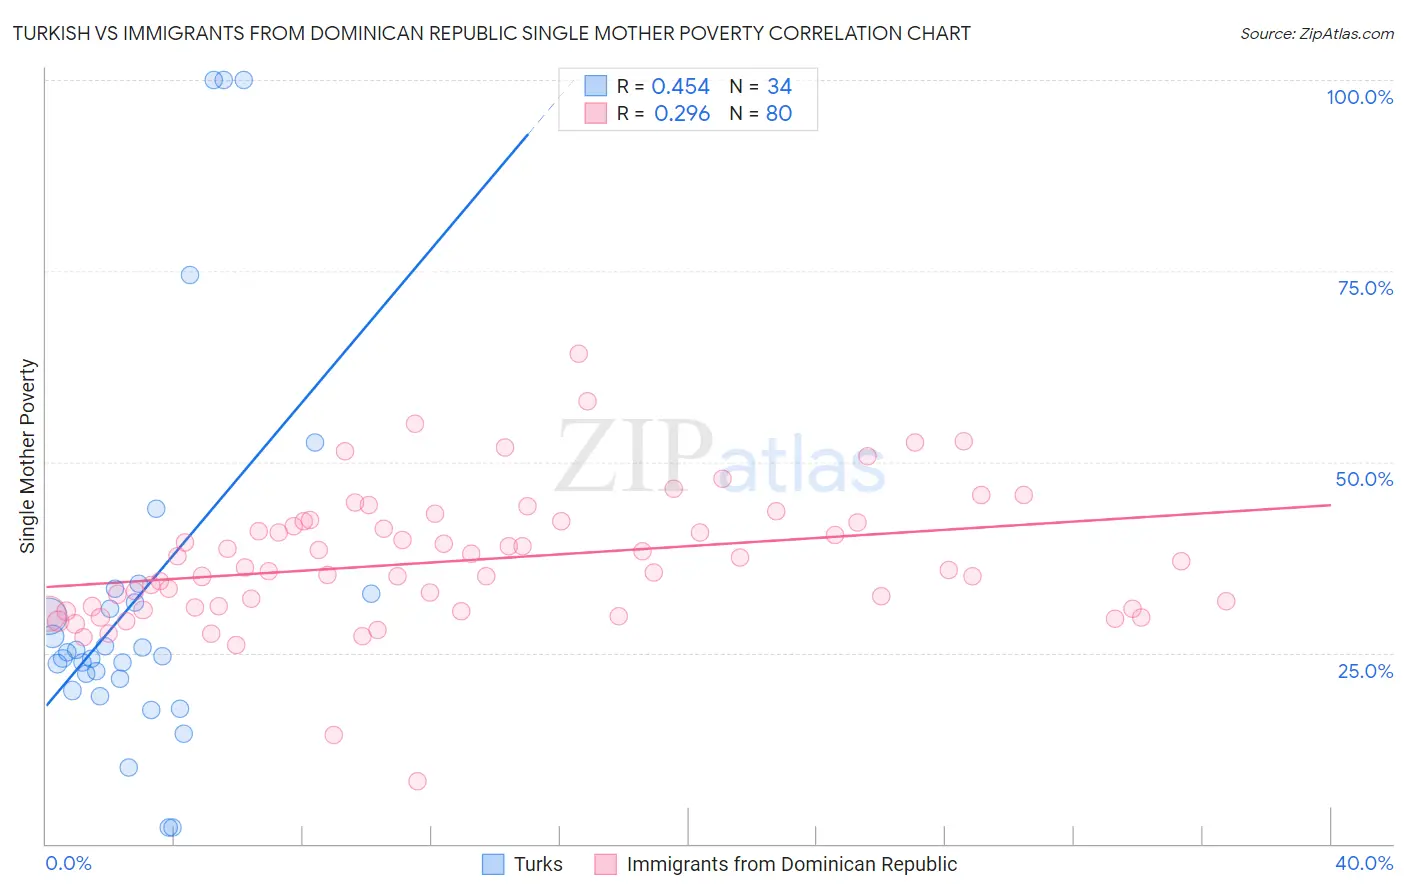
Turkish vs Immigrants from Dominican Republic Single Mother Poverty Correlation Chart
The statistical analysis conducted on geographies consisting of 265,895,030 people shows a moderate positive correlation between the proportion of Turks and poverty level among single mothers in the United States with a correlation coefficient (R) of 0.454 and weighted average of 26.4%. Similarly, the statistical analysis conducted on geographies consisting of 269,699,812 people shows a weak positive correlation between the proportion of Immigrants from Dominican Republic and poverty level among single mothers in the United States with a correlation coefficient (R) of 0.296 and weighted average of 34.4%, a difference of 30.0%.
Single Mother Poverty Correlation Summary
| Measurement | Turkish | Immigrants from Dominican Republic |
| Minimum | 2.2% | 8.3% |
| Maximum | 100.0% | 64.2% |
| Range | 97.8% | 56.0% |
| Mean | 32.5% | 37.1% |
| Median | 24.8% | 36.0% |
| Interquartile 25% (IQ1) | 21.6% | 30.8% |
| Interquartile 75% (IQ3) | 32.8% | 42.1% |
| Interquartile Range (IQR) | 11.2% | 11.3% |
| Standard Deviation (Sample) | 24.9% | 8.9% |
| Standard Deviation (Population) | 24.5% | 8.9% |
Similar Demographics by Single Mother Poverty
Demographics Similar to Turks by Single Mother Poverty
In terms of single mother poverty, the demographic groups most similar to Turks are Jordanian (26.4%, a difference of 0.090%), Korean (26.4%, a difference of 0.14%), Immigrants from Japan (26.4%, a difference of 0.15%), Immigrants from Philippines (26.5%, a difference of 0.16%), and Immigrants from Sri Lanka (26.3%, a difference of 0.38%).
| Demographics | Rating | Rank | Single Mother Poverty |
| Burmese | 100.0 /100 | #23 | Exceptional 26.2% |
| Immigrants | Moldova | 100.0 /100 | #24 | Exceptional 26.2% |
| Immigrants | Asia | 100.0 /100 | #25 | Exceptional 26.3% |
| Immigrants | Sri Lanka | 100.0 /100 | #26 | Exceptional 26.3% |
| Immigrants | Japan | 100.0 /100 | #27 | Exceptional 26.4% |
| Koreans | 100.0 /100 | #28 | Exceptional 26.4% |
| Jordanians | 100.0 /100 | #29 | Exceptional 26.4% |
| Turks | 100.0 /100 | #30 | Exceptional 26.4% |
| Immigrants | Philippines | 100.0 /100 | #31 | Exceptional 26.5% |
| Tongans | 99.9 /100 | #32 | Exceptional 26.5% |
| Bulgarians | 99.9 /100 | #33 | Exceptional 26.5% |
| Immigrants | Indonesia | 99.9 /100 | #34 | Exceptional 26.6% |
| Maltese | 99.9 /100 | #35 | Exceptional 26.6% |
| Okinawans | 99.9 /100 | #36 | Exceptional 26.6% |
| Immigrants | Israel | 99.9 /100 | #37 | Exceptional 26.6% |
Demographics Similar to Immigrants from Dominican Republic by Single Mother Poverty
In terms of single mother poverty, the demographic groups most similar to Immigrants from Dominican Republic are Central American Indian (34.3%, a difference of 0.080%), Alsatian (34.3%, a difference of 0.16%), Chickasaw (34.4%, a difference of 0.17%), Hopi (34.5%, a difference of 0.25%), and Dominican (34.5%, a difference of 0.37%).
| Demographics | Rating | Rank | Single Mother Poverty |
| Immigrants | Congo | 0.0 /100 | #306 | Tragic 33.8% |
| Comanche | 0.0 /100 | #307 | Tragic 33.9% |
| Immigrants | Mexico | 0.0 /100 | #308 | Tragic 34.0% |
| Potawatomi | 0.0 /100 | #309 | Tragic 34.1% |
| Hondurans | 0.0 /100 | #310 | Tragic 34.2% |
| Alsatians | 0.0 /100 | #311 | Tragic 34.3% |
| Central American Indians | 0.0 /100 | #312 | Tragic 34.3% |
| Immigrants | Dominican Republic | 0.0 /100 | #313 | Tragic 34.4% |
| Chickasaw | 0.0 /100 | #314 | Tragic 34.4% |
| Hopi | 0.0 /100 | #315 | Tragic 34.5% |
| Dominicans | 0.0 /100 | #316 | Tragic 34.5% |
| Cherokee | 0.0 /100 | #317 | Tragic 34.5% |
| Immigrants | Honduras | 0.0 /100 | #318 | Tragic 34.7% |
| Chippewa | 0.0 /100 | #319 | Tragic 34.8% |
| Iroquois | 0.0 /100 | #320 | Tragic 34.8% |