Turkish vs Immigrants from Dominican Republic Professional Degree
COMPARE
Turkish
Immigrants from Dominican Republic
Professional Degree
Professional Degree Comparison
Turks
Immigrants from Dominican Republic
6.2%
PROFESSIONAL DEGREE
100.0/ 100
METRIC RATING
28th/ 347
METRIC RANK
3.4%
PROFESSIONAL DEGREE
0.2/ 100
METRIC RATING
301st/ 347
METRIC RANK
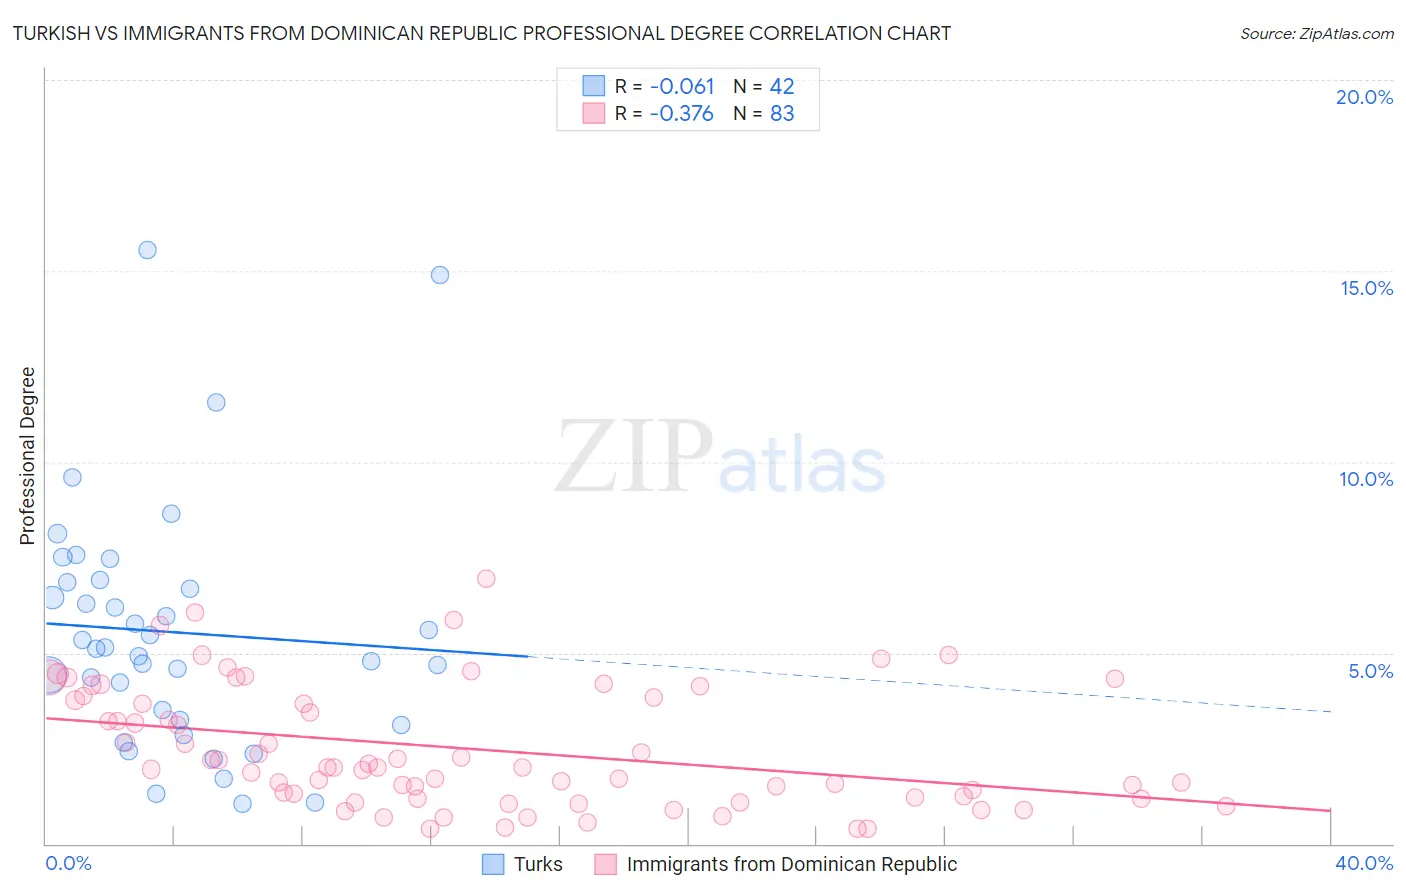
Turkish vs Immigrants from Dominican Republic Professional Degree Correlation Chart
The statistical analysis conducted on geographies consisting of 271,613,931 people shows a slight negative correlation between the proportion of Turks and percentage of population with at least professional degree education in the United States with a correlation coefficient (R) of -0.061 and weighted average of 6.2%. Similarly, the statistical analysis conducted on geographies consisting of 274,641,839 people shows a mild negative correlation between the proportion of Immigrants from Dominican Republic and percentage of population with at least professional degree education in the United States with a correlation coefficient (R) of -0.376 and weighted average of 3.4%, a difference of 82.7%.
Professional Degree Correlation Summary
| Measurement | Turkish | Immigrants from Dominican Republic |
| Minimum | 1.0% | 0.38% |
| Maximum | 15.6% | 7.0% |
| Range | 14.5% | 6.6% |
| Mean | 5.5% | 2.5% |
| Median | 5.1% | 2.0% |
| Interquartile 25% (IQ1) | 3.3% | 1.2% |
| Interquartile 75% (IQ3) | 6.9% | 3.8% |
| Interquartile Range (IQR) | 3.6% | 2.6% |
| Standard Deviation (Sample) | 3.2% | 1.6% |
| Standard Deviation (Population) | 3.2% | 1.6% |
Similar Demographics by Professional Degree
Demographics Similar to Turks by Professional Degree
In terms of professional degree, the demographic groups most similar to Turks are Immigrants from Northern Europe (6.2%, a difference of 0.11%), Latvian (6.2%, a difference of 0.62%), Immigrants from Sri Lanka (6.2%, a difference of 0.63%), Immigrants from Turkey (6.2%, a difference of 0.63%), and Immigrants from India (6.2%, a difference of 0.75%).
| Demographics | Rating | Rank | Professional Degree |
| Immigrants | Hong Kong | 100.0 /100 | #21 | Exceptional 6.4% |
| Immigrants | Japan | 100.0 /100 | #22 | Exceptional 6.4% |
| Russians | 100.0 /100 | #23 | Exceptional 6.3% |
| Immigrants | Spain | 100.0 /100 | #24 | Exceptional 6.3% |
| Immigrants | Ireland | 100.0 /100 | #25 | Exceptional 6.3% |
| Latvians | 100.0 /100 | #26 | Exceptional 6.2% |
| Immigrants | Northern Europe | 100.0 /100 | #27 | Exceptional 6.2% |
| Turks | 100.0 /100 | #28 | Exceptional 6.2% |
| Immigrants | Sri Lanka | 100.0 /100 | #29 | Exceptional 6.2% |
| Immigrants | Turkey | 100.0 /100 | #30 | Exceptional 6.2% |
| Immigrants | India | 100.0 /100 | #31 | Exceptional 6.2% |
| Thais | 100.0 /100 | #32 | Exceptional 6.1% |
| Burmese | 100.0 /100 | #33 | Exceptional 6.1% |
| Mongolians | 100.0 /100 | #34 | Exceptional 6.1% |
| Immigrants | Korea | 100.0 /100 | #35 | Exceptional 6.1% |
Demographics Similar to Immigrants from Dominican Republic by Professional Degree
In terms of professional degree, the demographic groups most similar to Immigrants from Dominican Republic are Malaysian (3.4%, a difference of 0.11%), Black/African American (3.4%, a difference of 0.14%), Immigrants from Yemen (3.4%, a difference of 0.28%), Immigrants from Haiti (3.4%, a difference of 0.76%), and Cajun (3.4%, a difference of 0.77%).
| Demographics | Rating | Rank | Professional Degree |
| Paiute | 0.3 /100 | #294 | Tragic 3.4% |
| Immigrants | Guatemala | 0.2 /100 | #295 | Tragic 3.4% |
| Hawaiians | 0.2 /100 | #296 | Tragic 3.4% |
| Immigrants | Liberia | 0.2 /100 | #297 | Tragic 3.4% |
| Ottawa | 0.2 /100 | #298 | Tragic 3.4% |
| Immigrants | Yemen | 0.2 /100 | #299 | Tragic 3.4% |
| Blacks/African Americans | 0.2 /100 | #300 | Tragic 3.4% |
| Immigrants | Dominican Republic | 0.2 /100 | #301 | Tragic 3.4% |
| Malaysians | 0.2 /100 | #302 | Tragic 3.4% |
| Immigrants | Haiti | 0.2 /100 | #303 | Tragic 3.4% |
| Cajuns | 0.2 /100 | #304 | Tragic 3.4% |
| Chickasaw | 0.1 /100 | #305 | Tragic 3.4% |
| Cape Verdeans | 0.1 /100 | #306 | Tragic 3.4% |
| Samoans | 0.1 /100 | #307 | Tragic 3.3% |
| Shoshone | 0.1 /100 | #308 | Tragic 3.3% |