Tsimshian vs Immigrants from Morocco Doctorate Degree
COMPARE
Tsimshian
Immigrants from Morocco
Doctorate Degree
Doctorate Degree Comparison
Tsimshian
Immigrants from Morocco
1.4%
DOCTORATE DEGREE
0.2/ 100
METRIC RATING
297th/ 347
METRIC RANK
2.0%
DOCTORATE DEGREE
95.5/ 100
METRIC RATING
120th/ 347
METRIC RANK
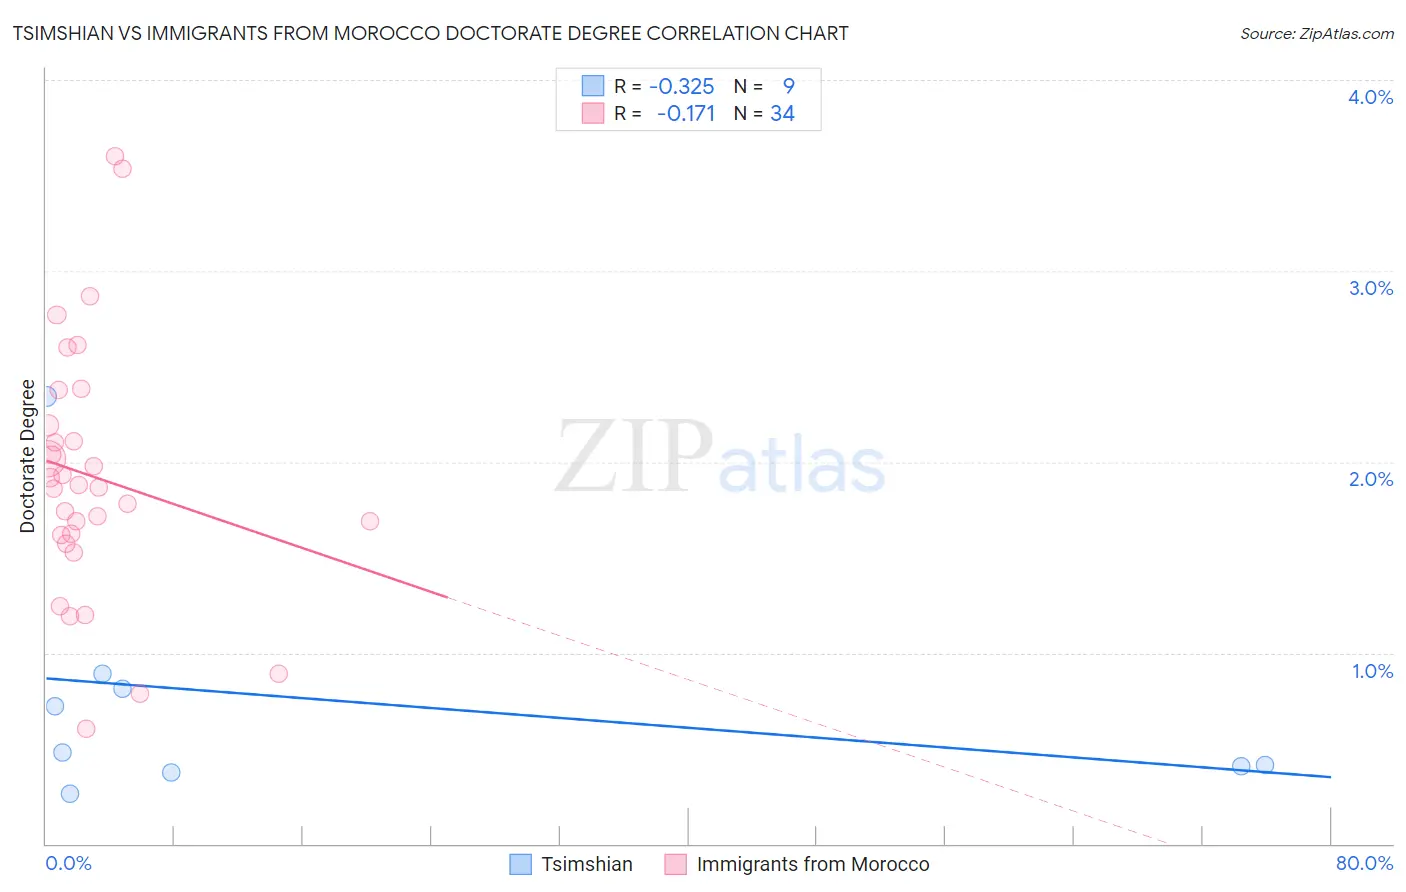
Tsimshian vs Immigrants from Morocco Doctorate Degree Correlation Chart
The statistical analysis conducted on geographies consisting of 15,584,822 people shows a mild negative correlation between the proportion of Tsimshian and percentage of population with at least doctorate degree education in the United States with a correlation coefficient (R) of -0.325 and weighted average of 1.4%. Similarly, the statistical analysis conducted on geographies consisting of 178,707,099 people shows a poor negative correlation between the proportion of Immigrants from Morocco and percentage of population with at least doctorate degree education in the United States with a correlation coefficient (R) of -0.171 and weighted average of 2.0%, a difference of 45.4%.
Doctorate Degree Correlation Summary
| Measurement | Tsimshian | Immigrants from Morocco |
| Minimum | 0.26% | 0.60% |
| Maximum | 2.3% | 3.6% |
| Range | 2.1% | 3.0% |
| Mean | 0.74% | 1.9% |
| Median | 0.48% | 1.9% |
| Interquartile 25% (IQ1) | 0.39% | 1.6% |
| Interquartile 75% (IQ3) | 0.85% | 2.2% |
| Interquartile Range (IQR) | 0.46% | 0.57% |
| Standard Deviation (Sample) | 0.64% | 0.67% |
| Standard Deviation (Population) | 0.60% | 0.66% |
Similar Demographics by Doctorate Degree
Demographics Similar to Tsimshian by Doctorate Degree
In terms of doctorate degree, the demographic groups most similar to Tsimshian are Immigrants from Ecuador (1.4%, a difference of 0.22%), Puerto Rican (1.4%, a difference of 0.41%), Guatemalan (1.4%, a difference of 0.45%), Belizean (1.4%, a difference of 0.85%), and Samoan (1.4%, a difference of 1.1%).
| Demographics | Rating | Rank | Doctorate Degree |
| Choctaw | 0.3 /100 | #290 | Tragic 1.4% |
| Blacks/African Americans | 0.3 /100 | #291 | Tragic 1.4% |
| Alaska Natives | 0.3 /100 | #292 | Tragic 1.4% |
| Immigrants | Yemen | 0.2 /100 | #293 | Tragic 1.4% |
| Samoans | 0.2 /100 | #294 | Tragic 1.4% |
| Guatemalans | 0.2 /100 | #295 | Tragic 1.4% |
| Immigrants | Ecuador | 0.2 /100 | #296 | Tragic 1.4% |
| Tsimshian | 0.2 /100 | #297 | Tragic 1.4% |
| Puerto Ricans | 0.1 /100 | #298 | Tragic 1.4% |
| Belizeans | 0.1 /100 | #299 | Tragic 1.4% |
| Immigrants | Guatemala | 0.1 /100 | #300 | Tragic 1.4% |
| Hondurans | 0.1 /100 | #301 | Tragic 1.4% |
| Shoshone | 0.1 /100 | #302 | Tragic 1.4% |
| Immigrants | Dominica | 0.1 /100 | #303 | Tragic 1.4% |
| Mexican American Indians | 0.1 /100 | #304 | Tragic 1.4% |
Demographics Similar to Immigrants from Morocco by Doctorate Degree
In terms of doctorate degree, the demographic groups most similar to Immigrants from Morocco are Pakistani (2.0%, a difference of 0.28%), Icelander (2.1%, a difference of 0.42%), Lebanese (2.1%, a difference of 0.45%), Immigrants from Jordan (2.0%, a difference of 0.48%), and Immigrants from Southern Europe (2.0%, a difference of 0.50%).
| Demographics | Rating | Rank | Doctorate Degree |
| Immigrants | Italy | 96.9 /100 | #113 | Exceptional 2.1% |
| Immigrants | Croatia | 96.8 /100 | #114 | Exceptional 2.1% |
| Taiwanese | 96.7 /100 | #115 | Exceptional 2.1% |
| Maltese | 96.2 /100 | #116 | Exceptional 2.1% |
| Lebanese | 96.0 /100 | #117 | Exceptional 2.1% |
| Icelanders | 96.0 /100 | #118 | Exceptional 2.1% |
| Pakistanis | 95.8 /100 | #119 | Exceptional 2.0% |
| Immigrants | Morocco | 95.5 /100 | #120 | Exceptional 2.0% |
| Immigrants | Jordan | 94.8 /100 | #121 | Exceptional 2.0% |
| Immigrants | Southern Europe | 94.7 /100 | #122 | Exceptional 2.0% |
| Croatians | 94.0 /100 | #123 | Exceptional 2.0% |
| Ute | 93.2 /100 | #124 | Exceptional 2.0% |
| Moroccans | 93.0 /100 | #125 | Exceptional 2.0% |
| Jordanians | 92.1 /100 | #126 | Exceptional 2.0% |
| Palestinians | 92.0 /100 | #127 | Exceptional 2.0% |