Canadian vs Immigrants from Morocco 4 or more Vehicles in Household
COMPARE
Canadian
Immigrants from Morocco
4 or more Vehicles in Household
4 or more Vehicles in Household Comparison
Canadians
Immigrants from Morocco
6.9%
4 OR MORE VEHICLES IN HOUSEHOLD
96.4/ 100
METRIC RATING
113th/ 347
METRIC RANK
5.1%
4 OR MORE VEHICLES IN HOUSEHOLD
0.0/ 100
METRIC RATING
300th/ 347
METRIC RANK
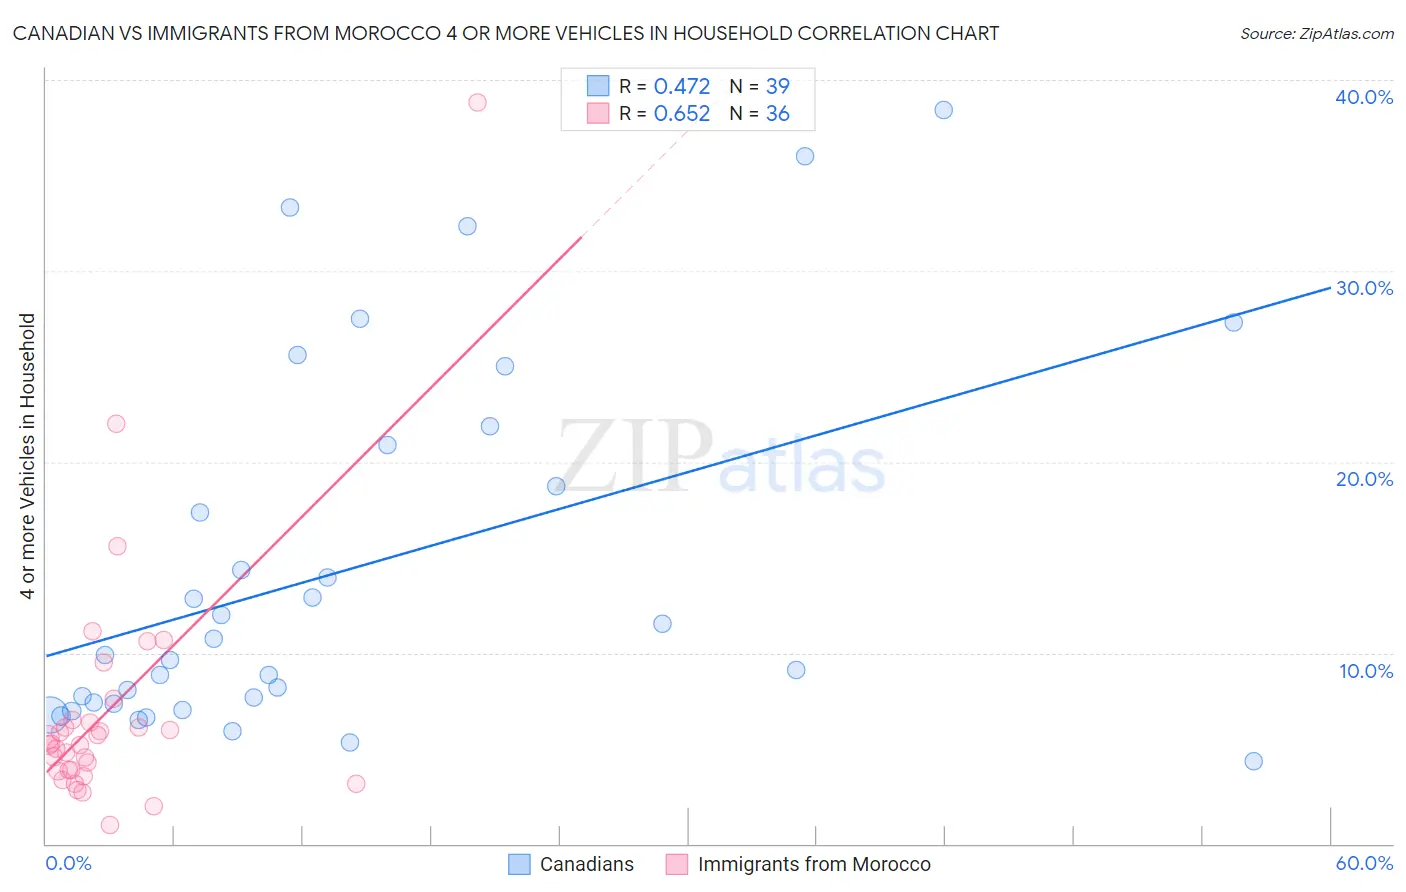
Canadian vs Immigrants from Morocco 4 or more Vehicles in Household Correlation Chart
The statistical analysis conducted on geographies consisting of 435,609,846 people shows a moderate positive correlation between the proportion of Canadians and percentage of households with 4 or more vehicles available in the United States with a correlation coefficient (R) of 0.472 and weighted average of 6.9%. Similarly, the statistical analysis conducted on geographies consisting of 178,286,205 people shows a significant positive correlation between the proportion of Immigrants from Morocco and percentage of households with 4 or more vehicles available in the United States with a correlation coefficient (R) of 0.652 and weighted average of 5.1%, a difference of 34.4%.
4 or more Vehicles in Household Correlation Summary
| Measurement | Canadian | Immigrants from Morocco |
| Minimum | 4.3% | 0.99% |
| Maximum | 38.5% | 38.8% |
| Range | 34.1% | 37.8% |
| Mean | 14.4% | 7.0% |
| Median | 9.9% | 5.2% |
| Interquartile 25% (IQ1) | 7.3% | 3.8% |
| Interquartile 75% (IQ3) | 20.9% | 6.4% |
| Interquartile Range (IQR) | 13.6% | 2.6% |
| Standard Deviation (Sample) | 9.6% | 6.7% |
| Standard Deviation (Population) | 9.4% | 6.6% |
Similar Demographics by 4 or more Vehicles in Household
Demographics Similar to Canadians by 4 or more Vehicles in Household
In terms of 4 or more vehicles in household, the demographic groups most similar to Canadians are Bolivian (6.8%, a difference of 0.050%), Tlingit-Haida (6.8%, a difference of 0.11%), Immigrants from Guatemala (6.8%, a difference of 0.37%), Burmese (6.8%, a difference of 0.40%), and French American Indian (6.8%, a difference of 0.40%).
| Demographics | Rating | Rank | 4 or more Vehicles in Household |
| Guatemalans | 98.1 /100 | #106 | Exceptional 7.0% |
| Nicaraguans | 98.0 /100 | #107 | Exceptional 7.0% |
| French | 97.7 /100 | #108 | Exceptional 6.9% |
| Filipinos | 97.6 /100 | #109 | Exceptional 6.9% |
| Immigrants | Thailand | 97.0 /100 | #110 | Exceptional 6.9% |
| Aleuts | 97.0 /100 | #111 | Exceptional 6.9% |
| Hopi | 97.0 /100 | #112 | Exceptional 6.9% |
| Canadians | 96.4 /100 | #113 | Exceptional 6.9% |
| Bolivians | 96.3 /100 | #114 | Exceptional 6.8% |
| Tlingit-Haida | 96.2 /100 | #115 | Exceptional 6.8% |
| Immigrants | Guatemala | 95.8 /100 | #116 | Exceptional 6.8% |
| Burmese | 95.7 /100 | #117 | Exceptional 6.8% |
| French American Indians | 95.7 /100 | #118 | Exceptional 6.8% |
| Costa Ricans | 95.5 /100 | #119 | Exceptional 6.8% |
| Comanche | 94.8 /100 | #120 | Exceptional 6.8% |
Demographics Similar to Immigrants from Morocco by 4 or more Vehicles in Household
In terms of 4 or more vehicles in household, the demographic groups most similar to Immigrants from Morocco are Immigrants from Zaire (5.1%, a difference of 0.080%), Bahamian (5.1%, a difference of 0.39%), Immigrants from Greece (5.1%, a difference of 0.86%), Cypriot (5.0%, a difference of 1.4%), and Somali (5.0%, a difference of 1.4%).
| Demographics | Rating | Rank | 4 or more Vehicles in Household |
| Immigrants | Congo | 0.1 /100 | #293 | Tragic 5.2% |
| Ghanaians | 0.1 /100 | #294 | Tragic 5.2% |
| Immigrants | Brazil | 0.1 /100 | #295 | Tragic 5.2% |
| Israelis | 0.1 /100 | #296 | Tragic 5.2% |
| Immigrants | Venezuela | 0.1 /100 | #297 | Tragic 5.2% |
| Immigrants | South America | 0.1 /100 | #298 | Tragic 5.2% |
| Immigrants | Ghana | 0.1 /100 | #299 | Tragic 5.2% |
| Immigrants | Morocco | 0.0 /100 | #300 | Tragic 5.1% |
| Immigrants | Zaire | 0.0 /100 | #301 | Tragic 5.1% |
| Bahamians | 0.0 /100 | #302 | Tragic 5.1% |
| Immigrants | Greece | 0.0 /100 | #303 | Tragic 5.1% |
| Cypriots | 0.0 /100 | #304 | Tragic 5.0% |
| Somalis | 0.0 /100 | #305 | Tragic 5.0% |
| Immigrants | Serbia | 0.0 /100 | #306 | Tragic 5.0% |
| Menominee | 0.0 /100 | #307 | Tragic 5.0% |