Tsimshian vs Immigrants from Morocco Vision Disability
COMPARE
Tsimshian
Immigrants from Morocco
Vision Disability
Vision Disability Comparison
Tsimshian
Immigrants from Morocco
3.2%
VISION DISABILITY
0.0/ 100
METRIC RATING
339th/ 347
METRIC RANK
2.1%
VISION DISABILITY
85.2/ 100
METRIC RATING
139th/ 347
METRIC RANK
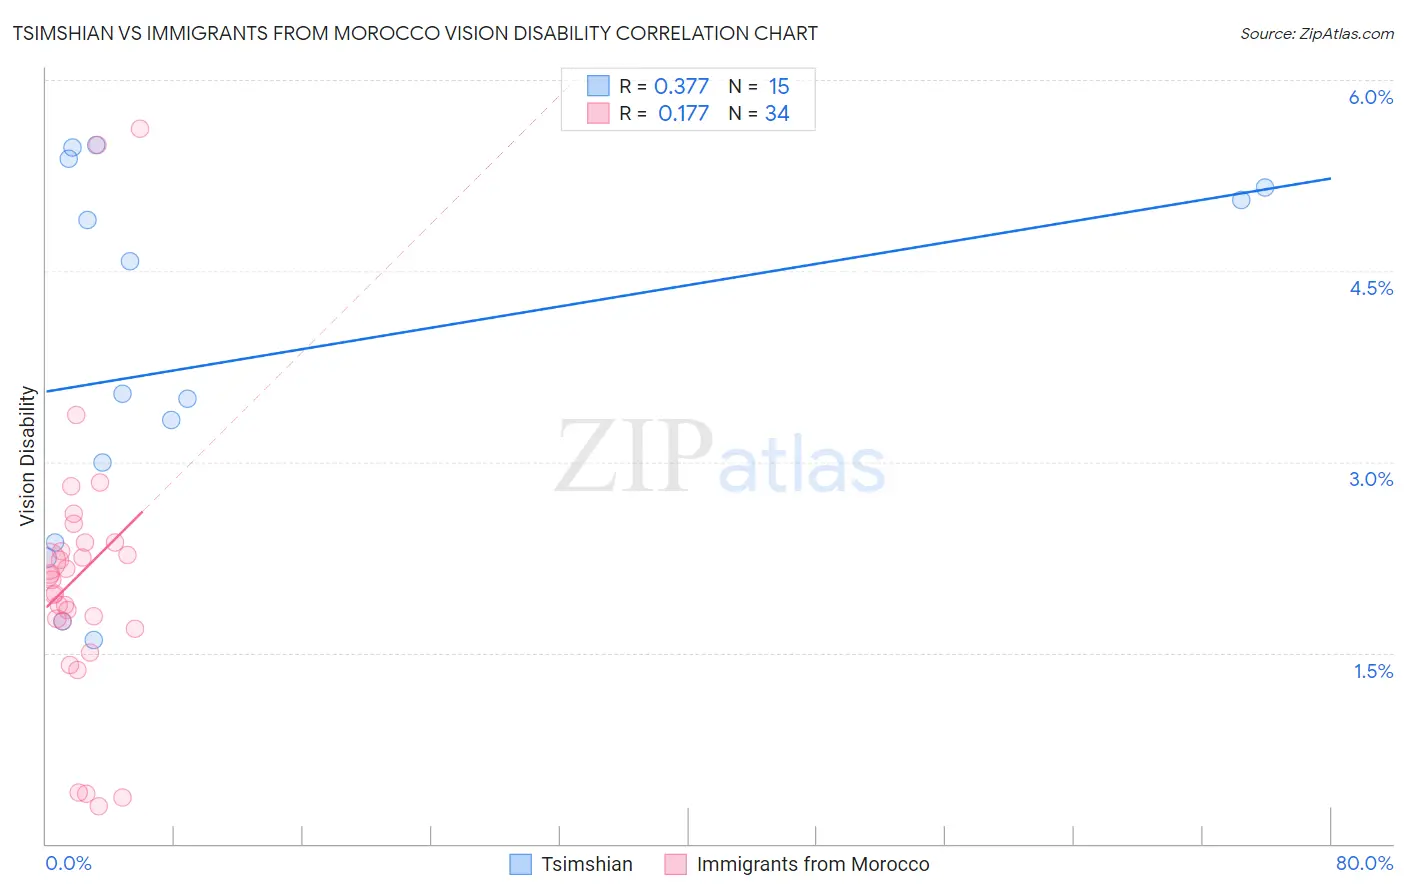
Tsimshian vs Immigrants from Morocco Vision Disability Correlation Chart
The statistical analysis conducted on geographies consisting of 15,626,544 people shows a mild positive correlation between the proportion of Tsimshian and percentage of population with vision disability in the United States with a correlation coefficient (R) of 0.377 and weighted average of 3.2%. Similarly, the statistical analysis conducted on geographies consisting of 178,891,599 people shows a poor positive correlation between the proportion of Immigrants from Morocco and percentage of population with vision disability in the United States with a correlation coefficient (R) of 0.177 and weighted average of 2.1%, a difference of 51.9%.
Vision Disability Correlation Summary
| Measurement | Tsimshian | Immigrants from Morocco |
| Minimum | 1.6% | 0.29% |
| Maximum | 5.5% | 5.6% |
| Range | 3.9% | 5.3% |
| Mean | 3.8% | 2.1% |
| Median | 3.5% | 2.1% |
| Interquartile 25% (IQ1) | 2.4% | 1.8% |
| Interquartile 75% (IQ3) | 5.2% | 2.4% |
| Interquartile Range (IQR) | 2.8% | 0.61% |
| Standard Deviation (Sample) | 1.4% | 1.1% |
| Standard Deviation (Population) | 1.4% | 1.1% |
Similar Demographics by Vision Disability
Demographics Similar to Tsimshian by Vision Disability
In terms of vision disability, the demographic groups most similar to Tsimshian are Creek (3.2%, a difference of 0.13%), Chickasaw (3.2%, a difference of 0.69%), Kiowa (3.3%, a difference of 1.6%), Dutch West Indian (3.2%, a difference of 1.6%), and Alaskan Athabascan (3.1%, a difference of 1.6%).
| Demographics | Rating | Rank | Vision Disability |
| Seminole | 0.0 /100 | #332 | Tragic 3.1% |
| Cajuns | 0.0 /100 | #333 | Tragic 3.1% |
| Cheyenne | 0.0 /100 | #334 | Tragic 3.1% |
| Navajo | 0.0 /100 | #335 | Tragic 3.1% |
| Alaskan Athabascans | 0.0 /100 | #336 | Tragic 3.1% |
| Dutch West Indians | 0.0 /100 | #337 | Tragic 3.2% |
| Chickasaw | 0.0 /100 | #338 | Tragic 3.2% |
| Tsimshian | 0.0 /100 | #339 | Tragic 3.2% |
| Creek | 0.0 /100 | #340 | Tragic 3.2% |
| Kiowa | 0.0 /100 | #341 | Tragic 3.3% |
| Choctaw | 0.0 /100 | #342 | Tragic 3.3% |
| Pima | 0.0 /100 | #343 | Tragic 3.3% |
| Pueblo | 0.0 /100 | #344 | Tragic 3.3% |
| Lumbee | 0.0 /100 | #345 | Tragic 3.4% |
| Houma | 0.0 /100 | #346 | Tragic 3.4% |
Demographics Similar to Immigrants from Morocco by Vision Disability
In terms of vision disability, the demographic groups most similar to Immigrants from Morocco are Immigrants from Netherlands (2.1%, a difference of 0.13%), Sierra Leonean (2.1%, a difference of 0.13%), Arab (2.1%, a difference of 0.14%), Czech (2.1%, a difference of 0.15%), and Immigrants from South Eastern Asia (2.1%, a difference of 0.15%).
| Demographics | Rating | Rank | Vision Disability |
| New Zealanders | 88.2 /100 | #132 | Excellent 2.1% |
| Syrians | 87.5 /100 | #133 | Excellent 2.1% |
| Venezuelans | 87.2 /100 | #134 | Excellent 2.1% |
| Vietnamese | 86.7 /100 | #135 | Excellent 2.1% |
| Czechs | 86.3 /100 | #136 | Excellent 2.1% |
| Immigrants | South Eastern Asia | 86.3 /100 | #137 | Excellent 2.1% |
| Arabs | 86.3 /100 | #138 | Excellent 2.1% |
| Immigrants | Morocco | 85.2 /100 | #139 | Excellent 2.1% |
| Immigrants | Netherlands | 84.2 /100 | #140 | Excellent 2.1% |
| Sierra Leoneans | 84.1 /100 | #141 | Excellent 2.1% |
| South Americans | 82.8 /100 | #142 | Excellent 2.1% |
| Immigrants | Sierra Leone | 82.8 /100 | #143 | Excellent 2.1% |
| Ukrainians | 81.9 /100 | #144 | Excellent 2.1% |
| Immigrants | Bosnia and Herzegovina | 81.5 /100 | #145 | Excellent 2.1% |
| Italians | 79.7 /100 | #146 | Good 2.1% |