Tsimshian vs Immigrants from Morocco Disability Age Over 75
COMPARE
Tsimshian
Immigrants from Morocco
Disability Age Over 75
Disability Age Over 75 Comparison
Tsimshian
Immigrants from Morocco
59.2%
DISABILITY AGE OVER 75
0.0/ 100
METRIC RATING
346th/ 347
METRIC RANK
47.1%
DISABILITY AGE OVER 75
71.4/ 100
METRIC RATING
159th/ 347
METRIC RANK
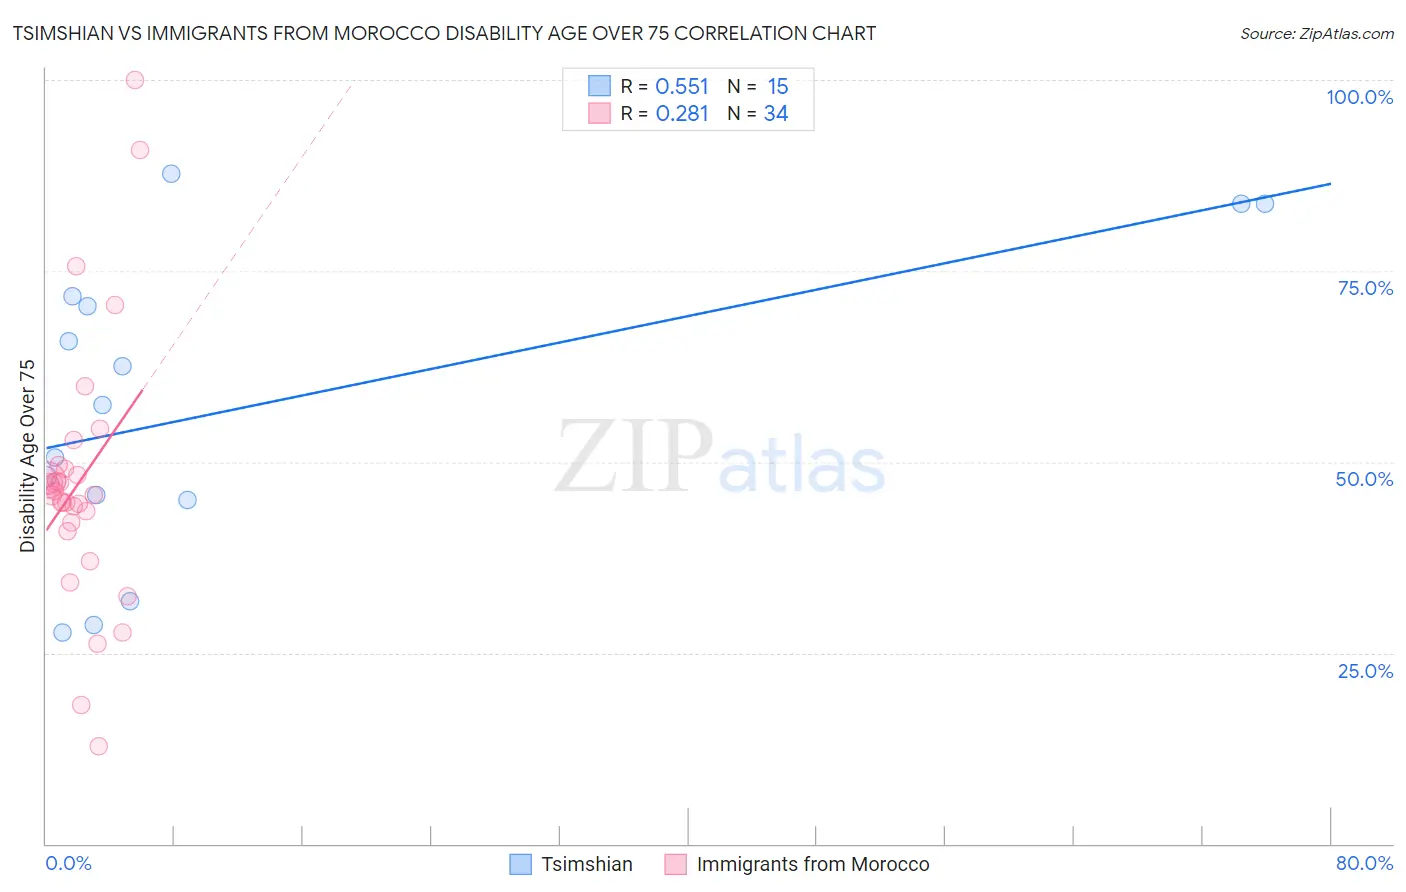
Tsimshian vs Immigrants from Morocco Disability Age Over 75 Correlation Chart
The statistical analysis conducted on geographies consisting of 15,620,176 people shows a substantial positive correlation between the proportion of Tsimshian and percentage of population with a disability over the age of 75 in the United States with a correlation coefficient (R) of 0.551 and weighted average of 59.2%. Similarly, the statistical analysis conducted on geographies consisting of 178,881,213 people shows a weak positive correlation between the proportion of Immigrants from Morocco and percentage of population with a disability over the age of 75 in the United States with a correlation coefficient (R) of 0.281 and weighted average of 47.1%, a difference of 25.7%.
Disability Age Over 75 Correlation Summary
| Measurement | Tsimshian | Immigrants from Morocco |
| Minimum | 27.7% | 12.8% |
| Maximum | 87.8% | 100.0% |
| Range | 60.1% | 87.2% |
| Mean | 57.4% | 47.3% |
| Median | 57.4% | 45.9% |
| Interquartile 25% (IQ1) | 45.0% | 42.1% |
| Interquartile 75% (IQ3) | 71.6% | 49.1% |
| Interquartile Range (IQR) | 26.6% | 7.0% |
| Standard Deviation (Sample) | 20.0% | 17.2% |
| Standard Deviation (Population) | 19.3% | 17.0% |
Similar Demographics by Disability Age Over 75
Demographics Similar to Tsimshian by Disability Age Over 75
In terms of disability age over 75, the demographic groups most similar to Tsimshian are Inupiat (58.4%, a difference of 1.4%), Navajo (58.3%, a difference of 1.6%), Yup'ik (61.1%, a difference of 3.2%), Tohono O'odham (56.7%, a difference of 4.4%), and Lumbee (56.2%, a difference of 5.3%).
| Demographics | Rating | Rank | Disability Age Over 75 |
| Apache | 0.0 /100 | #333 | Tragic 53.6% |
| Alaskan Athabascans | 0.0 /100 | #334 | Tragic 54.0% |
| Kiowa | 0.0 /100 | #335 | Tragic 54.2% |
| Immigrants | Armenia | 0.0 /100 | #336 | Tragic 54.3% |
| Yuman | 0.0 /100 | #337 | Tragic 54.4% |
| Colville | 0.0 /100 | #338 | Tragic 55.4% |
| Pima | 0.0 /100 | #339 | Tragic 55.8% |
| Pueblo | 0.0 /100 | #340 | Tragic 55.9% |
| Houma | 0.0 /100 | #341 | Tragic 56.2% |
| Lumbee | 0.0 /100 | #342 | Tragic 56.2% |
| Tohono O'odham | 0.0 /100 | #343 | Tragic 56.7% |
| Navajo | 0.0 /100 | #344 | Tragic 58.3% |
| Inupiat | 0.0 /100 | #345 | Tragic 58.4% |
| Tsimshian | 0.0 /100 | #346 | Tragic 59.2% |
| Yup'ik | 0.0 /100 | #347 | Tragic 61.1% |
Demographics Similar to Immigrants from Morocco by Disability Age Over 75
In terms of disability age over 75, the demographic groups most similar to Immigrants from Morocco are Immigrants from Guyana (47.1%, a difference of 0.010%), Bhutanese (47.1%, a difference of 0.030%), Arab (47.1%, a difference of 0.050%), Immigrants from Middle Africa (47.1%, a difference of 0.080%), and Immigrants from Iran (47.1%, a difference of 0.090%).
| Demographics | Rating | Rank | Disability Age Over 75 |
| Immigrants | Asia | 76.5 /100 | #152 | Good 47.0% |
| Immigrants | Zaire | 74.8 /100 | #153 | Good 47.1% |
| Immigrants | Belarus | 74.8 /100 | #154 | Good 47.1% |
| Immigrants | Iran | 74.7 /100 | #155 | Good 47.1% |
| Arabs | 73.3 /100 | #156 | Good 47.1% |
| Bhutanese | 72.6 /100 | #157 | Good 47.1% |
| Immigrants | Guyana | 71.9 /100 | #158 | Good 47.1% |
| Immigrants | Morocco | 71.4 /100 | #159 | Good 47.1% |
| Immigrants | Middle Africa | 68.3 /100 | #160 | Good 47.1% |
| South American Indians | 68.1 /100 | #161 | Good 47.1% |
| Pennsylvania Germans | 66.0 /100 | #162 | Good 47.2% |
| Immigrants | Eastern Africa | 65.5 /100 | #163 | Good 47.2% |
| French | 64.6 /100 | #164 | Good 47.2% |
| Immigrants | Zimbabwe | 64.4 /100 | #165 | Good 47.2% |
| Immigrants | Sierra Leone | 64.4 /100 | #166 | Good 47.2% |