Armenian vs Alsatian 2 or more Vehicles in Household
COMPARE
Armenian
Alsatian
2 or more Vehicles in Household
2 or more Vehicles in Household Comparison
Armenians
Alsatians
56.3%
2 OR MORE VEHICLES IN HOUSEHOLD
84.3/ 100
METRIC RATING
139th/ 347
METRIC RANK
52.5%
2 OR MORE VEHICLES IN HOUSEHOLD
0.6/ 100
METRIC RATING
259th/ 347
METRIC RANK
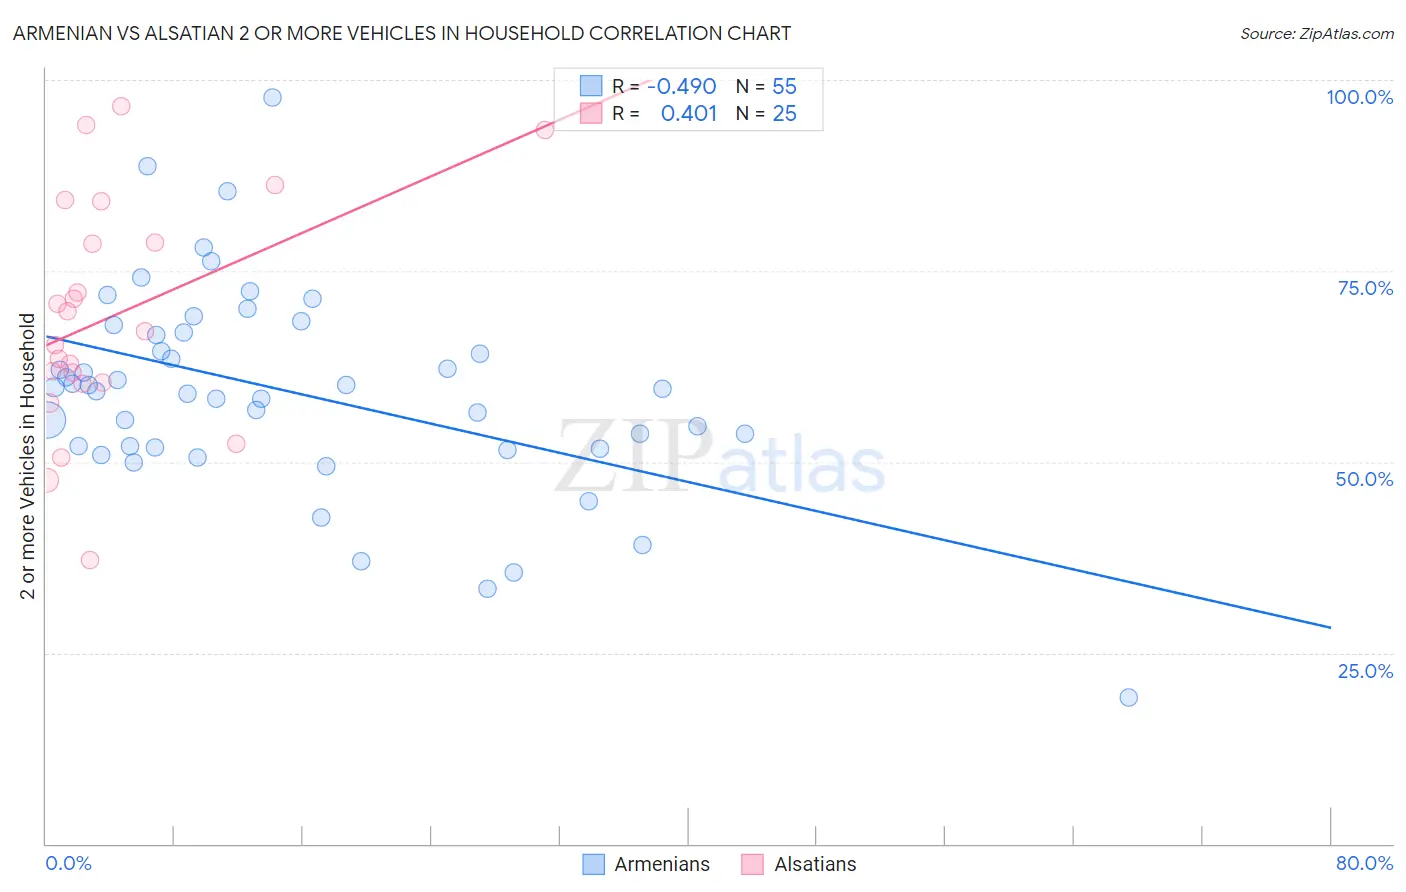
Armenian vs Alsatian 2 or more Vehicles in Household Correlation Chart
The statistical analysis conducted on geographies consisting of 310,821,659 people shows a moderate negative correlation between the proportion of Armenians and percentage of households with 2 or more vehicles available in the United States with a correlation coefficient (R) of -0.490 and weighted average of 56.3%. Similarly, the statistical analysis conducted on geographies consisting of 82,680,020 people shows a moderate positive correlation between the proportion of Alsatians and percentage of households with 2 or more vehicles available in the United States with a correlation coefficient (R) of 0.401 and weighted average of 52.5%, a difference of 7.2%.
2 or more Vehicles in Household Correlation Summary
| Measurement | Armenian | Alsatian |
| Minimum | 19.2% | 37.2% |
| Maximum | 97.7% | 96.6% |
| Range | 78.5% | 59.4% |
| Mean | 59.2% | 69.1% |
| Median | 59.5% | 67.1% |
| Interquartile 25% (IQ1) | 51.9% | 60.3% |
| Interquartile 75% (IQ3) | 67.0% | 81.4% |
| Interquartile Range (IQR) | 15.1% | 21.1% |
| Standard Deviation (Sample) | 13.6% | 15.1% |
| Standard Deviation (Population) | 13.4% | 14.8% |
Similar Demographics by 2 or more Vehicles in Household
Demographics Similar to Armenians by 2 or more Vehicles in Household
In terms of 2 or more vehicles in household, the demographic groups most similar to Armenians are Salvadoran (56.3%, a difference of 0.030%), Cuban (56.3%, a difference of 0.040%), Latvian (56.2%, a difference of 0.050%), Immigrants from Cambodia (56.2%, a difference of 0.050%), and South African (56.2%, a difference of 0.090%).
| Demographics | Rating | Rank | 2 or more Vehicles in Household |
| Hungarians | 89.1 /100 | #132 | Excellent 56.5% |
| Comanche | 88.4 /100 | #133 | Excellent 56.5% |
| Immigrants | Azores | 86.6 /100 | #134 | Excellent 56.4% |
| Blackfeet | 86.5 /100 | #135 | Excellent 56.4% |
| Immigrants | Asia | 86.0 /100 | #136 | Excellent 56.3% |
| Cubans | 84.8 /100 | #137 | Excellent 56.3% |
| Salvadorans | 84.7 /100 | #138 | Excellent 56.3% |
| Armenians | 84.3 /100 | #139 | Excellent 56.3% |
| Latvians | 83.6 /100 | #140 | Excellent 56.2% |
| Immigrants | Cambodia | 83.6 /100 | #141 | Excellent 56.2% |
| South Africans | 83.1 /100 | #142 | Excellent 56.2% |
| Seminole | 81.7 /100 | #143 | Excellent 56.2% |
| Immigrants | Syria | 81.4 /100 | #144 | Excellent 56.2% |
| Syrians | 81.2 /100 | #145 | Excellent 56.2% |
| Venezuelans | 80.7 /100 | #146 | Excellent 56.1% |
Demographics Similar to Alsatians by 2 or more Vehicles in Household
In terms of 2 or more vehicles in household, the demographic groups most similar to Alsatians are Central American Indian (52.5%, a difference of 0.040%), Immigrants from Bahamas (52.5%, a difference of 0.070%), Immigrants from Australia (52.4%, a difference of 0.10%), Immigrants from Hong Kong (52.6%, a difference of 0.14%), and Immigrants from Eritrea (52.6%, a difference of 0.28%).
| Demographics | Rating | Rank | 2 or more Vehicles in Household |
| Immigrants | Portugal | 1.0 /100 | #252 | Tragic 52.8% |
| Nigerians | 0.9 /100 | #253 | Tragic 52.8% |
| Immigrants | Malaysia | 0.8 /100 | #254 | Tragic 52.7% |
| Uruguayans | 0.7 /100 | #255 | Tragic 52.7% |
| Immigrants | Eritrea | 0.7 /100 | #256 | Tragic 52.6% |
| Immigrants | Hong Kong | 0.6 /100 | #257 | Tragic 52.6% |
| Central American Indians | 0.6 /100 | #258 | Tragic 52.5% |
| Alsatians | 0.6 /100 | #259 | Tragic 52.5% |
| Immigrants | Bahamas | 0.5 /100 | #260 | Tragic 52.5% |
| Immigrants | Australia | 0.5 /100 | #261 | Tragic 52.4% |
| Immigrants | Northern Africa | 0.4 /100 | #262 | Tragic 52.3% |
| Immigrants | Southern Europe | 0.4 /100 | #263 | Tragic 52.3% |
| Immigrants | Latvia | 0.4 /100 | #264 | Tragic 52.2% |
| Immigrants | Congo | 0.3 /100 | #265 | Tragic 52.1% |
| Immigrants | France | 0.2 /100 | #266 | Tragic 52.0% |