Immigrants from Korea vs Alsatian 2 or more Vehicles in Household
COMPARE
Immigrants from Korea
Alsatian
2 or more Vehicles in Household
2 or more Vehicles in Household Comparison
Immigrants from Korea
Alsatians
57.6%
2 OR MORE VEHICLES IN HOUSEHOLD
98.2/ 100
METRIC RATING
105th/ 347
METRIC RANK
52.5%
2 OR MORE VEHICLES IN HOUSEHOLD
0.6/ 100
METRIC RATING
259th/ 347
METRIC RANK
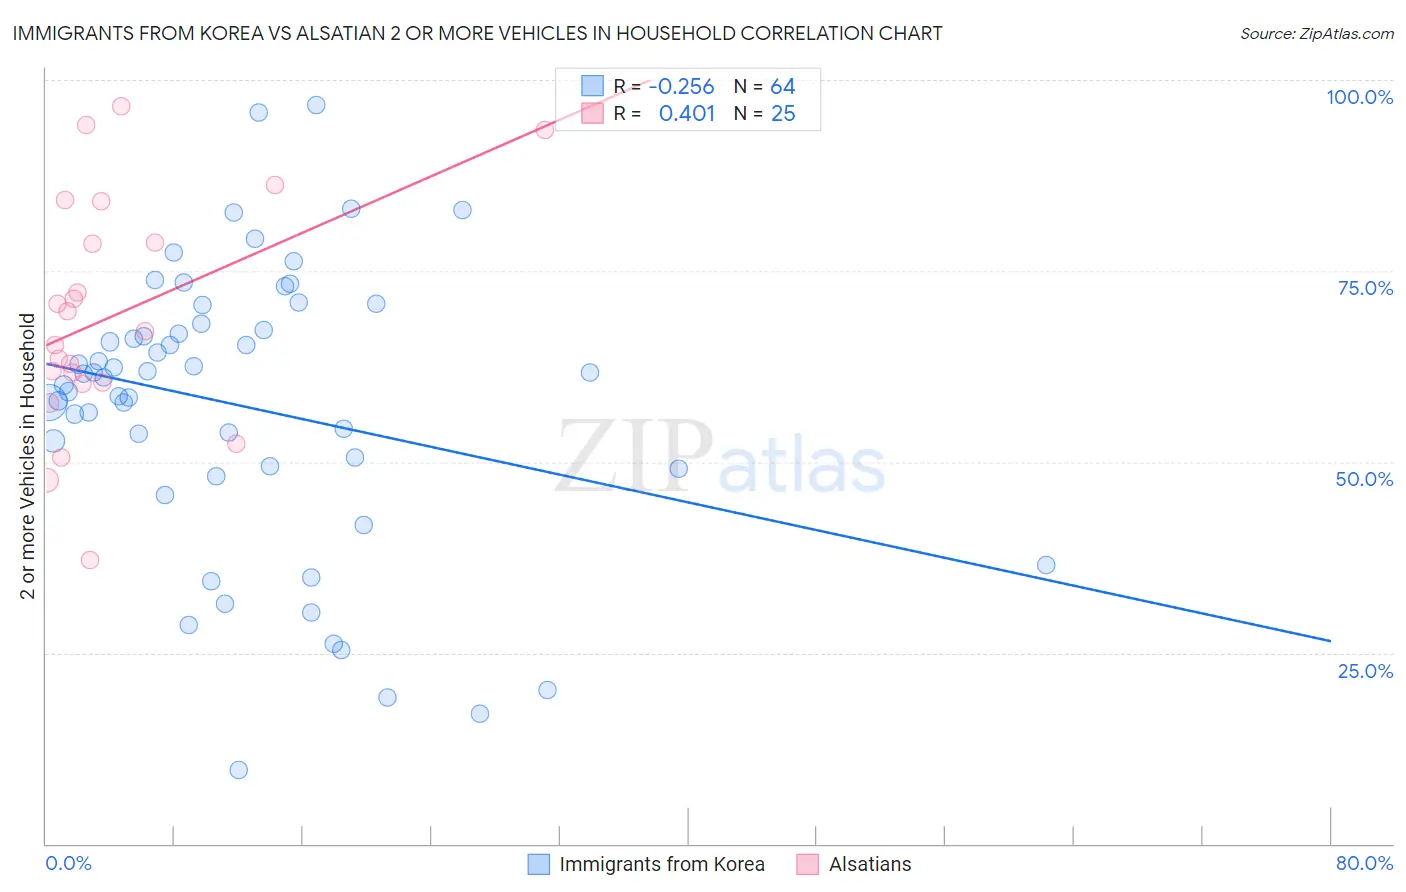
Immigrants from Korea vs Alsatian 2 or more Vehicles in Household Correlation Chart
The statistical analysis conducted on geographies consisting of 416,005,379 people shows a weak negative correlation between the proportion of Immigrants from Korea and percentage of households with 2 or more vehicles available in the United States with a correlation coefficient (R) of -0.256 and weighted average of 57.6%. Similarly, the statistical analysis conducted on geographies consisting of 82,680,020 people shows a moderate positive correlation between the proportion of Alsatians and percentage of households with 2 or more vehicles available in the United States with a correlation coefficient (R) of 0.401 and weighted average of 52.5%, a difference of 9.7%.
2 or more Vehicles in Household Correlation Summary
| Measurement | Immigrants from Korea | Alsatian |
| Minimum | 9.7% | 37.2% |
| Maximum | 96.7% | 96.6% |
| Range | 86.9% | 59.4% |
| Mean | 57.3% | 69.1% |
| Median | 61.3% | 67.1% |
| Interquartile 25% (IQ1) | 49.3% | 60.3% |
| Interquartile 75% (IQ3) | 67.7% | 81.4% |
| Interquartile Range (IQR) | 18.4% | 21.1% |
| Standard Deviation (Sample) | 18.6% | 15.1% |
| Standard Deviation (Population) | 18.5% | 14.8% |
Similar Demographics by 2 or more Vehicles in Household
Demographics Similar to Immigrants from Korea by 2 or more Vehicles in Household
In terms of 2 or more vehicles in household, the demographic groups most similar to Immigrants from Korea are Immigrants from Indonesia (57.6%, a difference of 0.0%), Immigrants from Bolivia (57.6%, a difference of 0.010%), Jordanian (57.6%, a difference of 0.010%), Immigrants from Oceania (57.5%, a difference of 0.020%), and Immigrants from Netherlands (57.5%, a difference of 0.030%).
| Demographics | Rating | Rank | 2 or more Vehicles in Household |
| Palestinians | 98.6 /100 | #98 | Exceptional 57.7% |
| Cajuns | 98.5 /100 | #99 | Exceptional 57.7% |
| Fijians | 98.4 /100 | #100 | Exceptional 57.6% |
| Lebanese | 98.3 /100 | #101 | Exceptional 57.6% |
| Immigrants | Bolivia | 98.2 /100 | #102 | Exceptional 57.6% |
| Jordanians | 98.2 /100 | #103 | Exceptional 57.6% |
| Immigrants | Indonesia | 98.2 /100 | #104 | Exceptional 57.6% |
| Immigrants | Korea | 98.2 /100 | #105 | Exceptional 57.6% |
| Immigrants | Oceania | 98.2 /100 | #106 | Exceptional 57.5% |
| Immigrants | Netherlands | 98.2 /100 | #107 | Exceptional 57.5% |
| Immigrants | Canada | 98.1 /100 | #108 | Exceptional 57.5% |
| Immigrants | North America | 98.1 /100 | #109 | Exceptional 57.5% |
| Japanese | 98.0 /100 | #110 | Exceptional 57.5% |
| Greeks | 98.0 /100 | #111 | Exceptional 57.5% |
| Pueblo | 98.0 /100 | #112 | Exceptional 57.5% |
Demographics Similar to Alsatians by 2 or more Vehicles in Household
In terms of 2 or more vehicles in household, the demographic groups most similar to Alsatians are Central American Indian (52.5%, a difference of 0.040%), Immigrants from Bahamas (52.5%, a difference of 0.070%), Immigrants from Australia (52.4%, a difference of 0.10%), Immigrants from Hong Kong (52.6%, a difference of 0.14%), and Immigrants from Eritrea (52.6%, a difference of 0.28%).
| Demographics | Rating | Rank | 2 or more Vehicles in Household |
| Immigrants | Portugal | 1.0 /100 | #252 | Tragic 52.8% |
| Nigerians | 0.9 /100 | #253 | Tragic 52.8% |
| Immigrants | Malaysia | 0.8 /100 | #254 | Tragic 52.7% |
| Uruguayans | 0.7 /100 | #255 | Tragic 52.7% |
| Immigrants | Eritrea | 0.7 /100 | #256 | Tragic 52.6% |
| Immigrants | Hong Kong | 0.6 /100 | #257 | Tragic 52.6% |
| Central American Indians | 0.6 /100 | #258 | Tragic 52.5% |
| Alsatians | 0.6 /100 | #259 | Tragic 52.5% |
| Immigrants | Bahamas | 0.5 /100 | #260 | Tragic 52.5% |
| Immigrants | Australia | 0.5 /100 | #261 | Tragic 52.4% |
| Immigrants | Northern Africa | 0.4 /100 | #262 | Tragic 52.3% |
| Immigrants | Southern Europe | 0.4 /100 | #263 | Tragic 52.3% |
| Immigrants | Latvia | 0.4 /100 | #264 | Tragic 52.2% |
| Immigrants | Congo | 0.3 /100 | #265 | Tragic 52.1% |
| Immigrants | France | 0.2 /100 | #266 | Tragic 52.0% |