Tongan vs Alsatian 3rd Grade
COMPARE
Tongan
Alsatian
3rd Grade
3rd Grade Comparison
Tongans
Alsatians
97.5%
3RD GRADE
4.3/ 100
METRIC RATING
225th/ 347
METRIC RANK
97.9%
3RD GRADE
78.3/ 100
METRIC RATING
146th/ 347
METRIC RANK
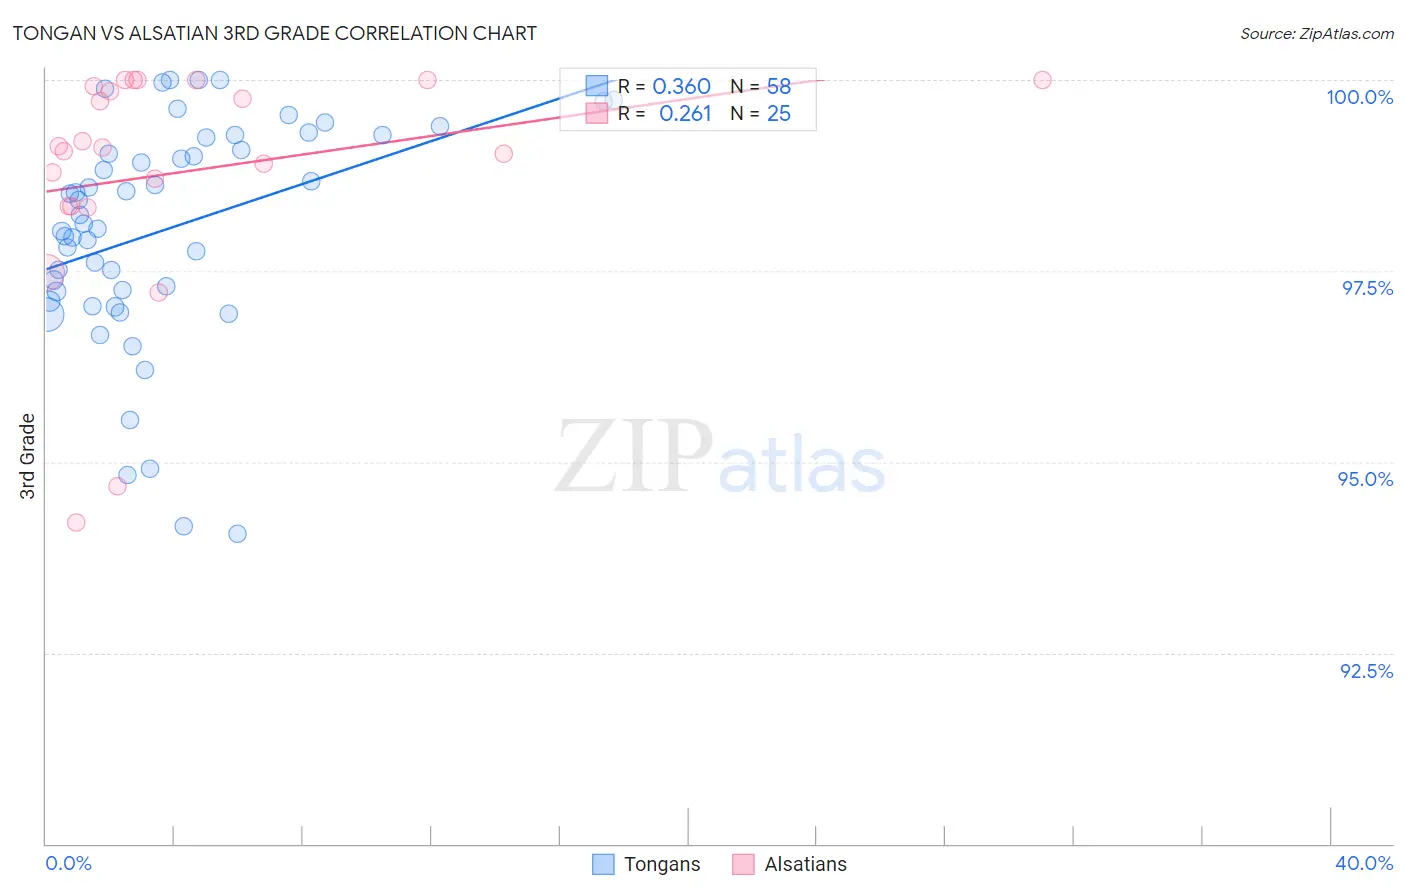
Tongan vs Alsatian 3rd Grade Correlation Chart
The statistical analysis conducted on geographies consisting of 102,908,759 people shows a mild positive correlation between the proportion of Tongans and percentage of population with at least 3rd grade education in the United States with a correlation coefficient (R) of 0.360 and weighted average of 97.5%. Similarly, the statistical analysis conducted on geographies consisting of 82,682,365 people shows a weak positive correlation between the proportion of Alsatians and percentage of population with at least 3rd grade education in the United States with a correlation coefficient (R) of 0.261 and weighted average of 97.9%, a difference of 0.37%.
3rd Grade Correlation Summary
| Measurement | Tongan | Alsatian |
| Minimum | 94.1% | 94.2% |
| Maximum | 100.0% | 100.0% |
| Range | 5.9% | 5.8% |
| Mean | 98.0% | 98.8% |
| Median | 98.2% | 99.1% |
| Interquartile 25% (IQ1) | 97.2% | 98.3% |
| Interquartile 75% (IQ3) | 99.3% | 100.0% |
| Interquartile Range (IQR) | 2.0% | 1.6% |
| Standard Deviation (Sample) | 1.5% | 1.5% |
| Standard Deviation (Population) | 1.4% | 1.5% |
Similar Demographics by 3rd Grade
Demographics Similar to Tongans by 3rd Grade
In terms of 3rd grade, the demographic groups most similar to Tongans are Sierra Leonean (97.5%, a difference of 0.0%), Immigrants from Syria (97.5%, a difference of 0.0%), Bahamian (97.5%, a difference of 0.0%), Sudanese (97.5%, a difference of 0.0%), and Immigrants from Morocco (97.5%, a difference of 0.010%).
| Demographics | Rating | Rank | 3rd Grade |
| Immigrants | Nepal | 5.3 /100 | #218 | Tragic 97.5% |
| Immigrants | Panama | 5.2 /100 | #219 | Tragic 97.5% |
| Immigrants | Morocco | 5.0 /100 | #220 | Tragic 97.5% |
| Uruguayans | 5.0 /100 | #221 | Tragic 97.5% |
| Sierra Leoneans | 4.6 /100 | #222 | Tragic 97.5% |
| Immigrants | Syria | 4.4 /100 | #223 | Tragic 97.5% |
| Bahamians | 4.4 /100 | #224 | Tragic 97.5% |
| Tongans | 4.3 /100 | #225 | Tragic 97.5% |
| Sudanese | 4.1 /100 | #226 | Tragic 97.5% |
| Immigrants | Sudan | 3.4 /100 | #227 | Tragic 97.5% |
| Sub-Saharan Africans | 3.2 /100 | #228 | Tragic 97.5% |
| Senegalese | 3.0 /100 | #229 | Tragic 97.5% |
| Immigrants | Pakistan | 2.7 /100 | #230 | Tragic 97.5% |
| Immigrants | Costa Rica | 2.7 /100 | #231 | Tragic 97.5% |
| Immigrants | Western Asia | 2.6 /100 | #232 | Tragic 97.5% |
Demographics Similar to Alsatians by 3rd Grade
In terms of 3rd grade, the demographic groups most similar to Alsatians are Immigrants from Israel (97.9%, a difference of 0.0%), Hmong (97.9%, a difference of 0.010%), Filipino (97.9%, a difference of 0.010%), Burmese (97.9%, a difference of 0.010%), and Immigrants from Greece (97.9%, a difference of 0.010%).
| Demographics | Rating | Rank | 3rd Grade |
| Blackfeet | 86.3 /100 | #139 | Excellent 97.9% |
| Palestinians | 84.6 /100 | #140 | Excellent 97.9% |
| Immigrants | Turkey | 83.5 /100 | #141 | Excellent 97.9% |
| Hmong | 80.3 /100 | #142 | Excellent 97.9% |
| Filipinos | 79.9 /100 | #143 | Good 97.9% |
| Burmese | 79.6 /100 | #144 | Good 97.9% |
| Immigrants | Greece | 79.5 /100 | #145 | Good 97.9% |
| Alsatians | 78.3 /100 | #146 | Good 97.9% |
| Immigrants | Israel | 77.3 /100 | #147 | Good 97.9% |
| Immigrants | Moldova | 77.1 /100 | #148 | Good 97.9% |
| Immigrants | North Macedonia | 74.5 /100 | #149 | Good 97.8% |
| Jordanians | 74.5 /100 | #150 | Good 97.8% |
| Soviet Union | 72.6 /100 | #151 | Good 97.8% |
| Immigrants | South Central Asia | 69.5 /100 | #152 | Good 97.8% |
| Apache | 68.5 /100 | #153 | Good 97.8% |