Palestinian vs Alsatian 2 or more Vehicles in Household
COMPARE
Palestinian
Alsatian
2 or more Vehicles in Household
2 or more Vehicles in Household Comparison
Palestinians
Alsatians
57.7%
2 OR MORE VEHICLES IN HOUSEHOLD
98.6/ 100
METRIC RATING
98th/ 347
METRIC RANK
52.5%
2 OR MORE VEHICLES IN HOUSEHOLD
0.6/ 100
METRIC RATING
259th/ 347
METRIC RANK
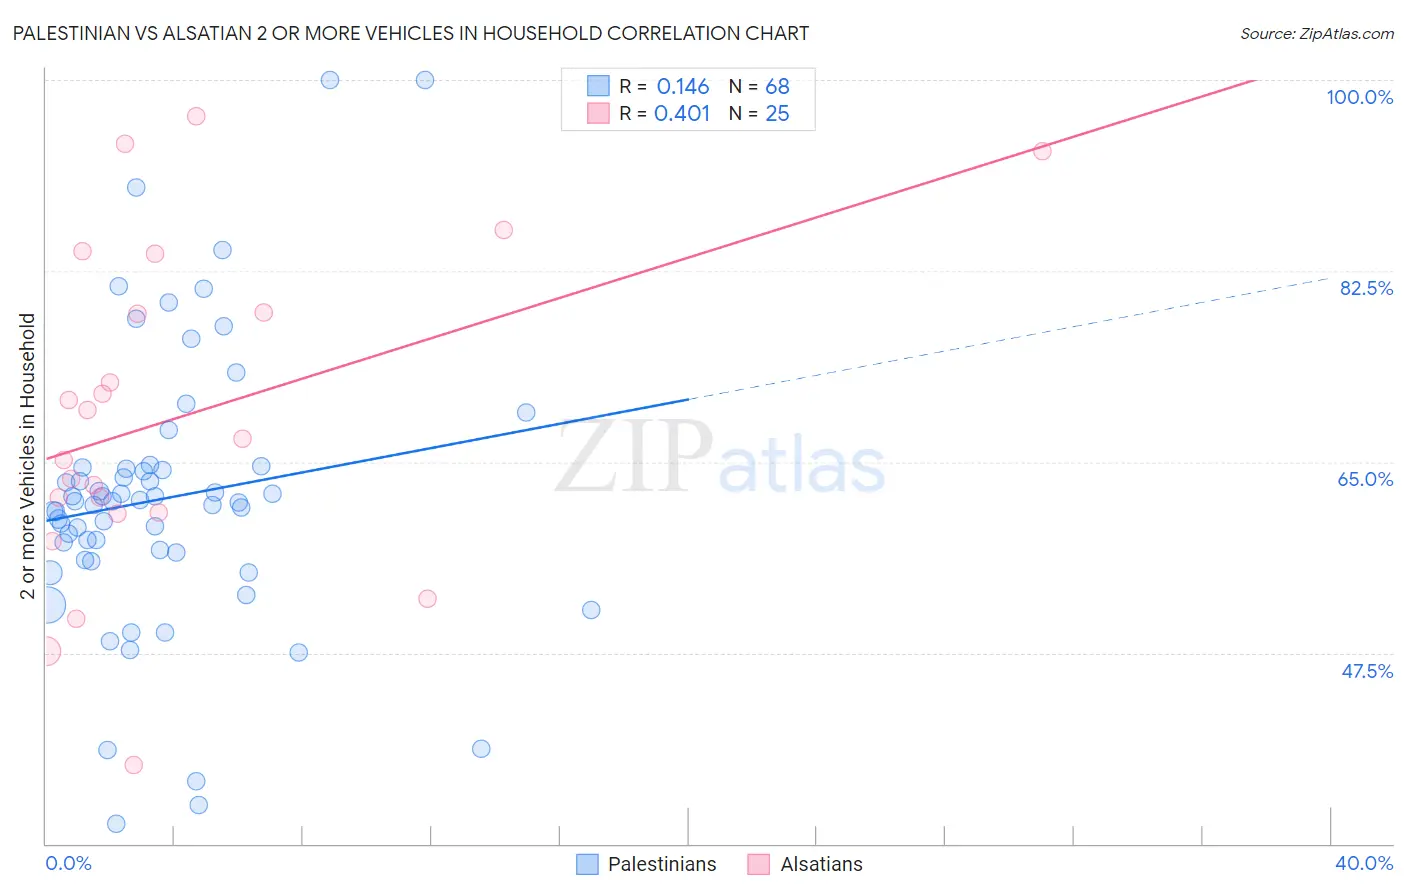
Palestinian vs Alsatian 2 or more Vehicles in Household Correlation Chart
The statistical analysis conducted on geographies consisting of 216,408,770 people shows a poor positive correlation between the proportion of Palestinians and percentage of households with 2 or more vehicles available in the United States with a correlation coefficient (R) of 0.146 and weighted average of 57.7%. Similarly, the statistical analysis conducted on geographies consisting of 82,680,020 people shows a moderate positive correlation between the proportion of Alsatians and percentage of households with 2 or more vehicles available in the United States with a correlation coefficient (R) of 0.401 and weighted average of 52.5%, a difference of 9.9%.
2 or more Vehicles in Household Correlation Summary
| Measurement | Palestinian | Alsatian |
| Minimum | 31.8% | 37.2% |
| Maximum | 100.0% | 96.6% |
| Range | 68.2% | 59.4% |
| Mean | 61.7% | 69.1% |
| Median | 61.4% | 67.1% |
| Interquartile 25% (IQ1) | 56.3% | 60.3% |
| Interquartile 75% (IQ3) | 64.5% | 81.4% |
| Interquartile Range (IQR) | 8.1% | 21.1% |
| Standard Deviation (Sample) | 13.0% | 15.1% |
| Standard Deviation (Population) | 12.9% | 14.8% |
Similar Demographics by 2 or more Vehicles in Household
Demographics Similar to Palestinians by 2 or more Vehicles in Household
In terms of 2 or more vehicles in household, the demographic groups most similar to Palestinians are Cajun (57.7%, a difference of 0.070%), Fijian (57.6%, a difference of 0.14%), Slavic (57.8%, a difference of 0.15%), Burmese (57.8%, a difference of 0.17%), and Lebanese (57.6%, a difference of 0.19%).
| Demographics | Rating | Rank | 2 or more Vehicles in Household |
| Pakistanis | 99.0 /100 | #91 | Exceptional 57.9% |
| Shoshone | 99.0 /100 | #92 | Exceptional 57.9% |
| Ottawa | 99.0 /100 | #93 | Exceptional 57.9% |
| Filipinos | 98.9 /100 | #94 | Exceptional 57.8% |
| Hmong | 98.9 /100 | #95 | Exceptional 57.8% |
| Burmese | 98.8 /100 | #96 | Exceptional 57.8% |
| Slavs | 98.8 /100 | #97 | Exceptional 57.8% |
| Palestinians | 98.6 /100 | #98 | Exceptional 57.7% |
| Cajuns | 98.5 /100 | #99 | Exceptional 57.7% |
| Fijians | 98.4 /100 | #100 | Exceptional 57.6% |
| Lebanese | 98.3 /100 | #101 | Exceptional 57.6% |
| Immigrants | Bolivia | 98.2 /100 | #102 | Exceptional 57.6% |
| Jordanians | 98.2 /100 | #103 | Exceptional 57.6% |
| Immigrants | Indonesia | 98.2 /100 | #104 | Exceptional 57.6% |
| Immigrants | Korea | 98.2 /100 | #105 | Exceptional 57.6% |
Demographics Similar to Alsatians by 2 or more Vehicles in Household
In terms of 2 or more vehicles in household, the demographic groups most similar to Alsatians are Central American Indian (52.5%, a difference of 0.040%), Immigrants from Bahamas (52.5%, a difference of 0.070%), Immigrants from Australia (52.4%, a difference of 0.10%), Immigrants from Hong Kong (52.6%, a difference of 0.14%), and Immigrants from Eritrea (52.6%, a difference of 0.28%).
| Demographics | Rating | Rank | 2 or more Vehicles in Household |
| Immigrants | Portugal | 1.0 /100 | #252 | Tragic 52.8% |
| Nigerians | 0.9 /100 | #253 | Tragic 52.8% |
| Immigrants | Malaysia | 0.8 /100 | #254 | Tragic 52.7% |
| Uruguayans | 0.7 /100 | #255 | Tragic 52.7% |
| Immigrants | Eritrea | 0.7 /100 | #256 | Tragic 52.6% |
| Immigrants | Hong Kong | 0.6 /100 | #257 | Tragic 52.6% |
| Central American Indians | 0.6 /100 | #258 | Tragic 52.5% |
| Alsatians | 0.6 /100 | #259 | Tragic 52.5% |
| Immigrants | Bahamas | 0.5 /100 | #260 | Tragic 52.5% |
| Immigrants | Australia | 0.5 /100 | #261 | Tragic 52.4% |
| Immigrants | Northern Africa | 0.4 /100 | #262 | Tragic 52.3% |
| Immigrants | Southern Europe | 0.4 /100 | #263 | Tragic 52.3% |
| Immigrants | Latvia | 0.4 /100 | #264 | Tragic 52.2% |
| Immigrants | Congo | 0.3 /100 | #265 | Tragic 52.1% |
| Immigrants | France | 0.2 /100 | #266 | Tragic 52.0% |