Immigrants from Latvia vs Vietnamese No Vehicles in Household
COMPARE
Immigrants from Latvia
Vietnamese
No Vehicles in Household
No Vehicles in Household Comparison
Immigrants from Latvia
Vietnamese
12.1%
NO VEHICLES IN HOUSEHOLD
0.8/ 100
METRIC RATING
259th/ 347
METRIC RANK
26.2%
NO VEHICLES IN HOUSEHOLD
0.0/ 100
METRIC RATING
336th/ 347
METRIC RANK
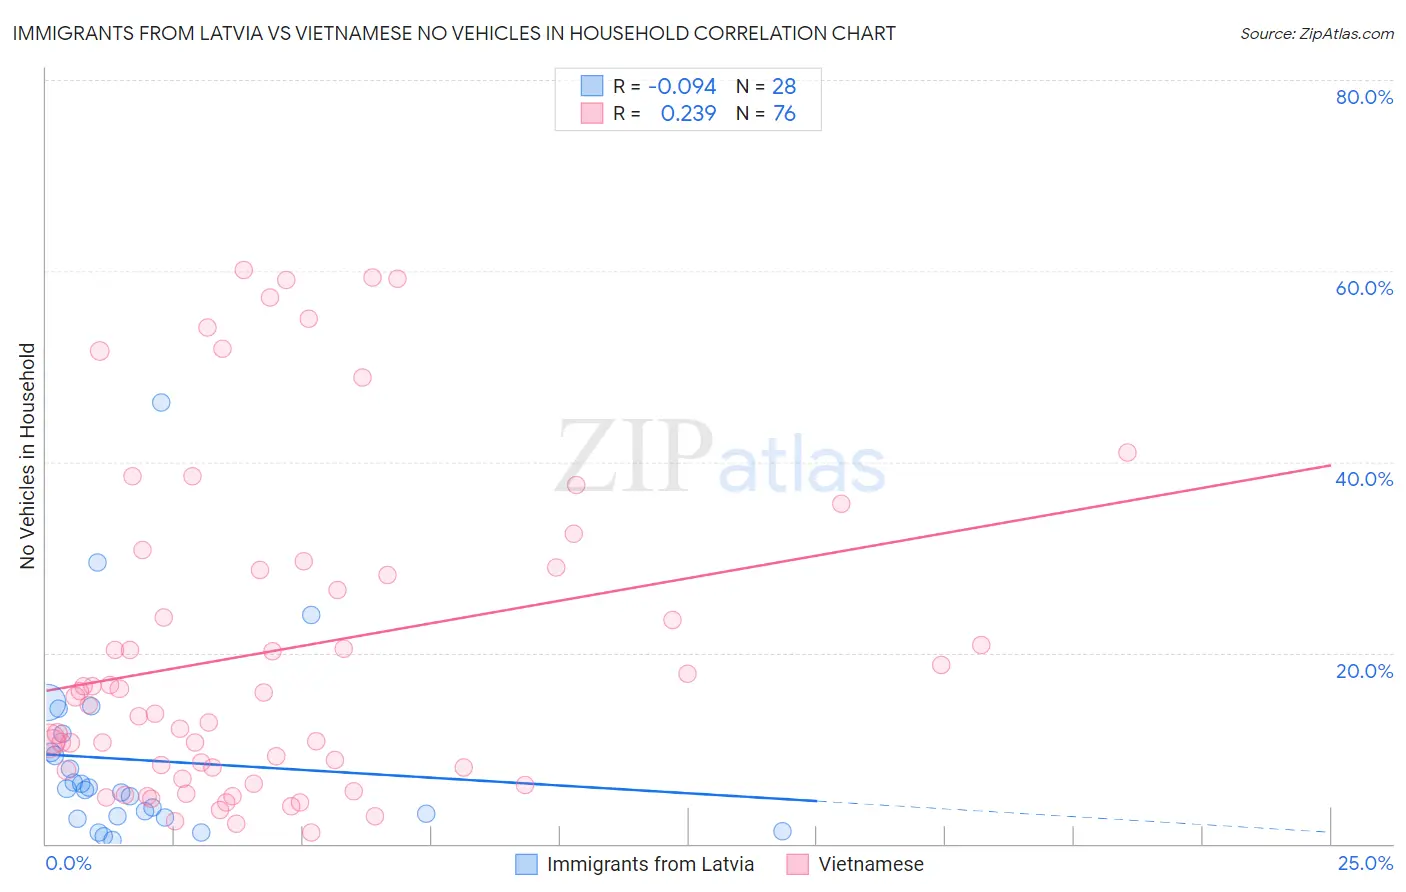
Immigrants from Latvia vs Vietnamese No Vehicles in Household Correlation Chart
The statistical analysis conducted on geographies consisting of 113,705,048 people shows a slight negative correlation between the proportion of Immigrants from Latvia and percentage of households with no vehicle available in the United States with a correlation coefficient (R) of -0.094 and weighted average of 12.1%. Similarly, the statistical analysis conducted on geographies consisting of 170,596,968 people shows a weak positive correlation between the proportion of Vietnamese and percentage of households with no vehicle available in the United States with a correlation coefficient (R) of 0.239 and weighted average of 26.2%, a difference of 116.9%.
No Vehicles in Household Correlation Summary
| Measurement | Immigrants from Latvia | Vietnamese |
| Minimum | 0.43% | 1.2% |
| Maximum | 46.2% | 60.1% |
| Range | 45.8% | 58.8% |
| Mean | 8.7% | 20.3% |
| Median | 5.7% | 15.0% |
| Interquartile 25% (IQ1) | 2.8% | 7.8% |
| Interquartile 75% (IQ3) | 10.5% | 28.8% |
| Interquartile Range (IQR) | 7.7% | 21.0% |
| Standard Deviation (Sample) | 10.1% | 16.9% |
| Standard Deviation (Population) | 9.9% | 16.8% |
Similar Demographics by No Vehicles in Household
Demographics Similar to Immigrants from Latvia by No Vehicles in Household
In terms of no vehicles in household, the demographic groups most similar to Immigrants from Latvia are South American Indian (12.1%, a difference of 0.24%), Nigerian (12.1%, a difference of 0.26%), Macedonian (12.2%, a difference of 0.55%), Subsaharan African (12.2%, a difference of 0.95%), and Liberian (12.0%, a difference of 1.0%).
| Demographics | Rating | Rank | No Vehicles in Household |
| Immigrants | Serbia | 1.5 /100 | #252 | Tragic 11.9% |
| Egyptians | 1.4 /100 | #253 | Tragic 11.9% |
| Immigrants | Uruguay | 1.3 /100 | #254 | Tragic 11.9% |
| Hondurans | 1.2 /100 | #255 | Tragic 12.0% |
| Liberians | 1.2 /100 | #256 | Tragic 12.0% |
| Nigerians | 0.9 /100 | #257 | Tragic 12.1% |
| South American Indians | 0.9 /100 | #258 | Tragic 12.1% |
| Immigrants | Latvia | 0.8 /100 | #259 | Tragic 12.1% |
| Macedonians | 0.7 /100 | #260 | Tragic 12.2% |
| Sub-Saharan Africans | 0.6 /100 | #261 | Tragic 12.2% |
| Immigrants | Liberia | 0.6 /100 | #262 | Tragic 12.2% |
| Immigrants | Egypt | 0.6 /100 | #263 | Tragic 12.2% |
| Immigrants | Switzerland | 0.5 /100 | #264 | Tragic 12.3% |
| Africans | 0.4 /100 | #265 | Tragic 12.3% |
| Israelis | 0.3 /100 | #266 | Tragic 12.4% |
Demographics Similar to Vietnamese by No Vehicles in Household
In terms of no vehicles in household, the demographic groups most similar to Vietnamese are Barbadian (26.1%, a difference of 0.56%), Immigrants from Uzbekistan (26.7%, a difference of 1.7%), Immigrants from Bangladesh (25.8%, a difference of 1.9%), Immigrants from Trinidad and Tobago (24.6%, a difference of 6.5%), and Immigrants from Ecuador (23.8%, a difference of 10.1%).
| Demographics | Rating | Rank | No Vehicles in Household |
| Ecuadorians | 0.0 /100 | #329 | Tragic 22.8% |
| West Indians | 0.0 /100 | #330 | Tragic 23.7% |
| Trinidadians and Tobagonians | 0.0 /100 | #331 | Tragic 23.7% |
| Immigrants | Ecuador | 0.0 /100 | #332 | Tragic 23.8% |
| Immigrants | Trinidad and Tobago | 0.0 /100 | #333 | Tragic 24.6% |
| Immigrants | Bangladesh | 0.0 /100 | #334 | Tragic 25.8% |
| Barbadians | 0.0 /100 | #335 | Tragic 26.1% |
| Vietnamese | 0.0 /100 | #336 | Tragic 26.2% |
| Immigrants | Uzbekistan | 0.0 /100 | #337 | Tragic 26.7% |
| Guyanese | 0.0 /100 | #338 | Tragic 29.3% |
| Dominicans | 0.0 /100 | #339 | Tragic 29.4% |
| Immigrants | Barbados | 0.0 /100 | #340 | Tragic 29.5% |
| Immigrants | Guyana | 0.0 /100 | #341 | Tragic 29.5% |
| British West Indians | 0.0 /100 | #342 | Tragic 29.7% |
| Inupiat | 0.0 /100 | #343 | Tragic 29.9% |