Tlingit-Haida vs Venezuelan Unemployment Among Youth under 25 years
COMPARE
Tlingit-Haida
Venezuelan
Unemployment Among Youth under 25 years
Unemployment Among Youth under 25 years Comparison
Tlingit-Haida
Venezuelans
12.7%
UNEMPLOYMENT AMONG YOUTH UNDER 25 YEARS
0.0/ 100
METRIC RATING
268th/ 347
METRIC RANK
10.6%
UNEMPLOYMENT AMONG YOUTH UNDER 25 YEARS
100.0/ 100
METRIC RATING
16th/ 347
METRIC RANK
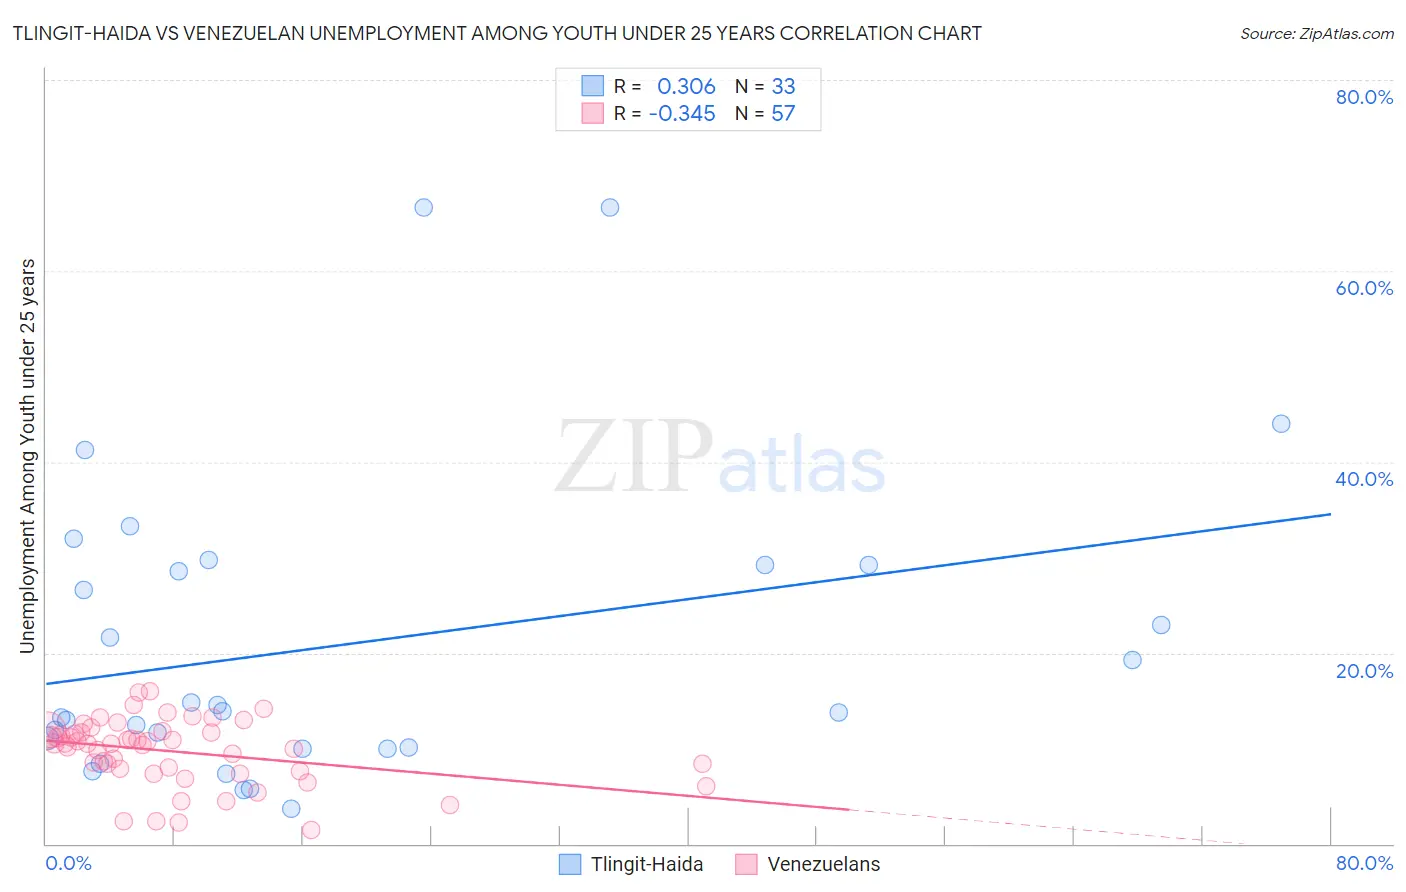
Tlingit-Haida vs Venezuelan Unemployment Among Youth under 25 years Correlation Chart
The statistical analysis conducted on geographies consisting of 60,635,463 people shows a mild positive correlation between the proportion of Tlingit-Haida and unemployment rate among youth under the age of 25 in the United States with a correlation coefficient (R) of 0.306 and weighted average of 12.7%. Similarly, the statistical analysis conducted on geographies consisting of 304,160,206 people shows a mild negative correlation between the proportion of Venezuelans and unemployment rate among youth under the age of 25 in the United States with a correlation coefficient (R) of -0.345 and weighted average of 10.6%, a difference of 19.7%.
Unemployment Among Youth under 25 years Correlation Summary
| Measurement | Tlingit-Haida | Venezuelan |
| Minimum | 3.7% | 1.4% |
| Maximum | 66.6% | 16.0% |
| Range | 62.9% | 14.6% |
| Mean | 20.9% | 9.7% |
| Median | 13.9% | 10.5% |
| Interquartile 25% (IQ1) | 10.1% | 7.7% |
| Interquartile 75% (IQ3) | 29.2% | 11.8% |
| Interquartile Range (IQR) | 19.1% | 4.1% |
| Standard Deviation (Sample) | 15.8% | 3.4% |
| Standard Deviation (Population) | 15.6% | 3.4% |
Similar Demographics by Unemployment Among Youth under 25 years
Demographics Similar to Tlingit-Haida by Unemployment Among Youth under 25 years
In terms of unemployment among youth under 25 years, the demographic groups most similar to Tlingit-Haida are Subsaharan African (12.6%, a difference of 0.080%), Kiowa (12.7%, a difference of 0.12%), Immigrants from Latin America (12.6%, a difference of 0.21%), Nepalese (12.5%, a difference of 1.1%), and Puget Sound Salish (12.5%, a difference of 1.2%).
| Demographics | Rating | Rank | Unemployment Among Youth under 25 years |
| Immigrants | El Salvador | 0.1 /100 | #261 | Tragic 12.4% |
| Immigrants | Mexico | 0.1 /100 | #262 | Tragic 12.4% |
| Cree | 0.1 /100 | #263 | Tragic 12.4% |
| Puget Sound Salish | 0.1 /100 | #264 | Tragic 12.5% |
| Nepalese | 0.0 /100 | #265 | Tragic 12.5% |
| Immigrants | Latin America | 0.0 /100 | #266 | Tragic 12.6% |
| Sub-Saharan Africans | 0.0 /100 | #267 | Tragic 12.6% |
| Tlingit-Haida | 0.0 /100 | #268 | Tragic 12.7% |
| Kiowa | 0.0 /100 | #269 | Tragic 12.7% |
| Immigrants | Liberia | 0.0 /100 | #270 | Tragic 12.8% |
| Immigrants | Bahamas | 0.0 /100 | #271 | Tragic 12.9% |
| Cape Verdeans | 0.0 /100 | #272 | Tragic 12.9% |
| Nigerians | 0.0 /100 | #273 | Tragic 13.0% |
| Immigrants | Nigeria | 0.0 /100 | #274 | Tragic 13.0% |
| Bermudans | 0.0 /100 | #275 | Tragic 13.0% |
Demographics Similar to Venezuelans by Unemployment Among Youth under 25 years
In terms of unemployment among youth under 25 years, the demographic groups most similar to Venezuelans are Sudanese (10.6%, a difference of 0.010%), Menominee (10.6%, a difference of 0.050%), Cuban (10.6%, a difference of 0.12%), Indonesian (10.6%, a difference of 0.14%), and Swiss (10.6%, a difference of 0.20%).
| Demographics | Rating | Rank | Unemployment Among Youth under 25 years |
| Germans | 100.0 /100 | #9 | Exceptional 10.5% |
| Immigrants | Somalia | 100.0 /100 | #10 | Exceptional 10.5% |
| Scandinavians | 100.0 /100 | #11 | Exceptional 10.5% |
| Immigrants | Sudan | 100.0 /100 | #12 | Exceptional 10.5% |
| Indonesians | 100.0 /100 | #13 | Exceptional 10.6% |
| Cubans | 100.0 /100 | #14 | Exceptional 10.6% |
| Sudanese | 100.0 /100 | #15 | Exceptional 10.6% |
| Venezuelans | 100.0 /100 | #16 | Exceptional 10.6% |
| Menominee | 100.0 /100 | #17 | Exceptional 10.6% |
| Swiss | 100.0 /100 | #18 | Exceptional 10.6% |
| Immigrants | Burma/Myanmar | 100.0 /100 | #19 | Exceptional 10.6% |
| Dutch | 100.0 /100 | #20 | Exceptional 10.6% |
| Pennsylvania Germans | 100.0 /100 | #21 | Exceptional 10.6% |
| Belgians | 100.0 /100 | #22 | Exceptional 10.6% |
| Immigrants | Bosnia and Herzegovina | 100.0 /100 | #23 | Exceptional 10.6% |