Assyrian/Chaldean/Syriac vs Pueblo No Vehicles in Household
COMPARE
Assyrian/Chaldean/Syriac
Pueblo
No Vehicles in Household
No Vehicles in Household Comparison
Assyrians/Chaldeans/Syriacs
Pueblo
7.0%
NO VEHICLES IN HOUSEHOLD
100.0/ 100
METRIC RATING
12th/ 347
METRIC RANK
10.8%
NO VEHICLES IN HOUSEHOLD
27.0/ 100
METRIC RATING
194th/ 347
METRIC RANK
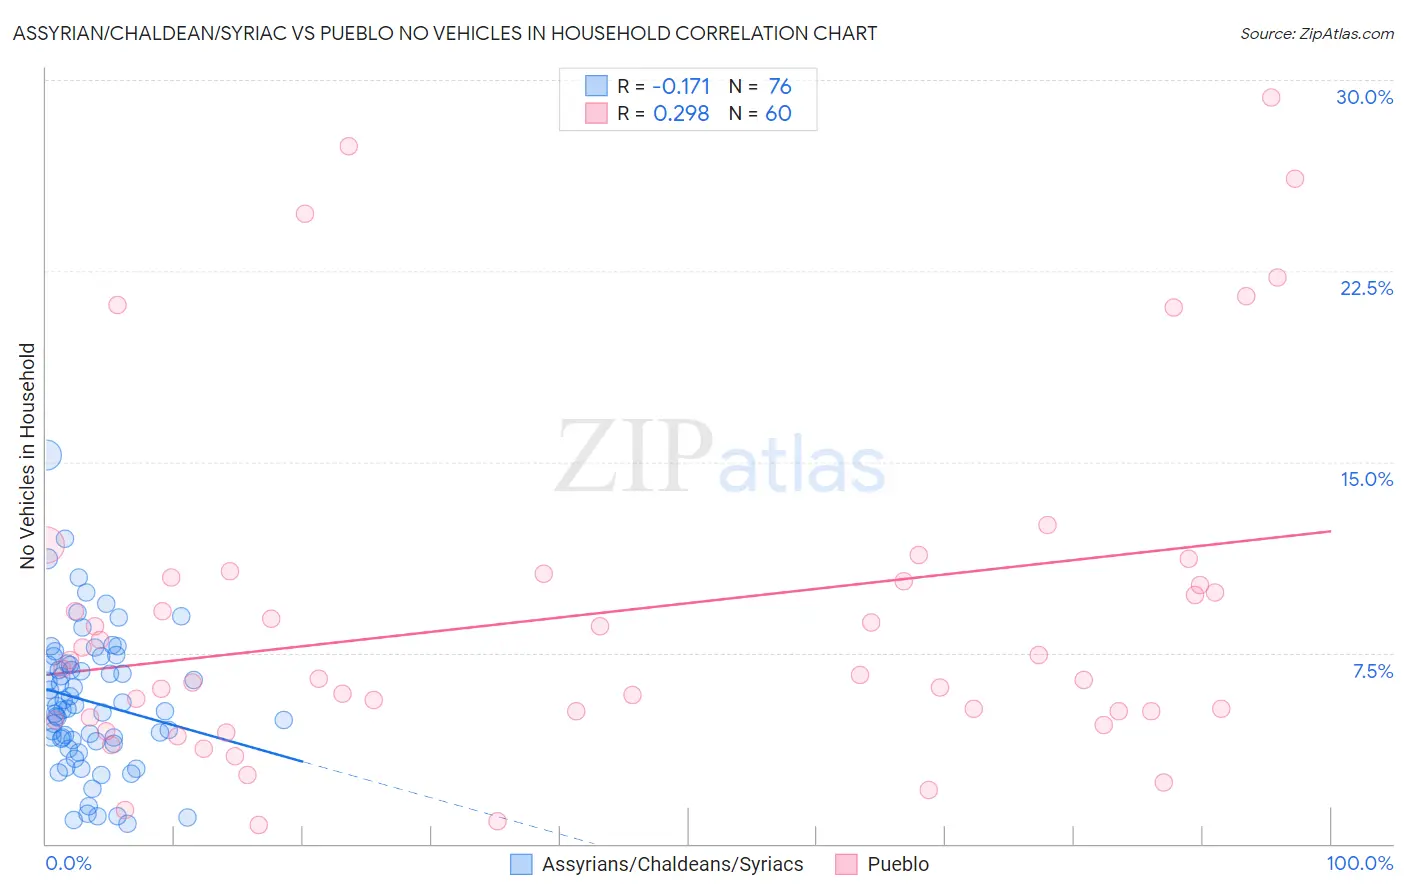
Assyrian/Chaldean/Syriac vs Pueblo No Vehicles in Household Correlation Chart
The statistical analysis conducted on geographies consisting of 110,265,900 people shows a poor negative correlation between the proportion of Assyrians/Chaldeans/Syriacs and percentage of households with no vehicle available in the United States with a correlation coefficient (R) of -0.171 and weighted average of 7.0%. Similarly, the statistical analysis conducted on geographies consisting of 120,011,033 people shows a weak positive correlation between the proportion of Pueblo and percentage of households with no vehicle available in the United States with a correlation coefficient (R) of 0.298 and weighted average of 10.8%, a difference of 54.1%.
No Vehicles in Household Correlation Summary
| Measurement | Assyrian/Chaldean/Syriac | Pueblo |
| Minimum | 0.78% | 0.72% |
| Maximum | 15.3% | 29.3% |
| Range | 14.5% | 28.6% |
| Mean | 5.6% | 9.0% |
| Median | 5.3% | 6.7% |
| Interquartile 25% (IQ1) | 4.0% | 5.1% |
| Interquartile 75% (IQ3) | 7.0% | 10.4% |
| Interquartile Range (IQR) | 3.0% | 5.3% |
| Standard Deviation (Sample) | 2.7% | 6.7% |
| Standard Deviation (Population) | 2.7% | 6.7% |
Similar Demographics by No Vehicles in Household
Demographics Similar to Assyrians/Chaldeans/Syriacs by No Vehicles in Household
In terms of no vehicles in household, the demographic groups most similar to Assyrians/Chaldeans/Syriacs are Scandinavian (7.0%, a difference of 0.50%), Mexican (7.0%, a difference of 0.67%), White/Caucasian (7.0%, a difference of 0.80%), Czech (6.9%, a difference of 1.4%), and European (7.1%, a difference of 2.0%).
| Demographics | Rating | Rank | No Vehicles in Household |
| Yakama | 100.0 /100 | #5 | Exceptional 6.6% |
| Germans | 100.0 /100 | #6 | Exceptional 6.7% |
| Scottish | 100.0 /100 | #7 | Exceptional 6.8% |
| Swedes | 100.0 /100 | #8 | Exceptional 6.8% |
| Scotch-Irish | 100.0 /100 | #9 | Exceptional 6.8% |
| Dutch | 100.0 /100 | #10 | Exceptional 6.8% |
| Czechs | 100.0 /100 | #11 | Exceptional 6.9% |
| Assyrians/Chaldeans/Syriacs | 100.0 /100 | #12 | Exceptional 7.0% |
| Scandinavians | 100.0 /100 | #13 | Exceptional 7.0% |
| Mexicans | 100.0 /100 | #14 | Exceptional 7.0% |
| Whites/Caucasians | 100.0 /100 | #15 | Exceptional 7.0% |
| Europeans | 100.0 /100 | #16 | Exceptional 7.1% |
| Welsh | 100.0 /100 | #17 | Exceptional 7.2% |
| Tongans | 100.0 /100 | #18 | Exceptional 7.2% |
| Arapaho | 100.0 /100 | #19 | Exceptional 7.4% |
Demographics Similar to Pueblo by No Vehicles in Household
In terms of no vehicles in household, the demographic groups most similar to Pueblo are Immigrants from Brazil (10.8%, a difference of 0.11%), Ukrainian (10.7%, a difference of 0.17%), Central American (10.8%, a difference of 0.45%), Shoshone (10.8%, a difference of 0.50%), and Immigrants from Sweden (10.8%, a difference of 0.71%).
| Demographics | Rating | Rank | No Vehicles in Household |
| Immigrants | Poland | 38.4 /100 | #187 | Fair 10.6% |
| Immigrants | Armenia | 37.5 /100 | #188 | Fair 10.6% |
| Immigrants | Eritrea | 36.3 /100 | #189 | Fair 10.6% |
| Immigrants | North Macedonia | 34.6 /100 | #190 | Fair 10.6% |
| Immigrants | Northern Europe | 33.1 /100 | #191 | Fair 10.7% |
| Carpatho Rusyns | 32.1 /100 | #192 | Fair 10.7% |
| Ukrainians | 28.0 /100 | #193 | Fair 10.7% |
| Pueblo | 27.0 /100 | #194 | Fair 10.8% |
| Immigrants | Brazil | 26.3 /100 | #195 | Fair 10.8% |
| Central Americans | 24.3 /100 | #196 | Fair 10.8% |
| Shoshone | 24.1 /100 | #197 | Fair 10.8% |
| Immigrants | Sweden | 22.9 /100 | #198 | Fair 10.8% |
| Immigrants | Asia | 21.3 /100 | #199 | Fair 10.9% |
| Cambodians | 19.6 /100 | #200 | Poor 10.9% |
| Immigrants | Western Europe | 19.1 /100 | #201 | Poor 10.9% |