Pennsylvania German vs Pueblo No Vehicles in Household
COMPARE
Pennsylvania German
Pueblo
No Vehicles in Household
No Vehicles in Household Comparison
Pennsylvania Germans
Pueblo
11.0%
NO VEHICLES IN HOUSEHOLD
15.5/ 100
METRIC RATING
209th/ 347
METRIC RANK
10.8%
NO VEHICLES IN HOUSEHOLD
27.0/ 100
METRIC RATING
194th/ 347
METRIC RANK
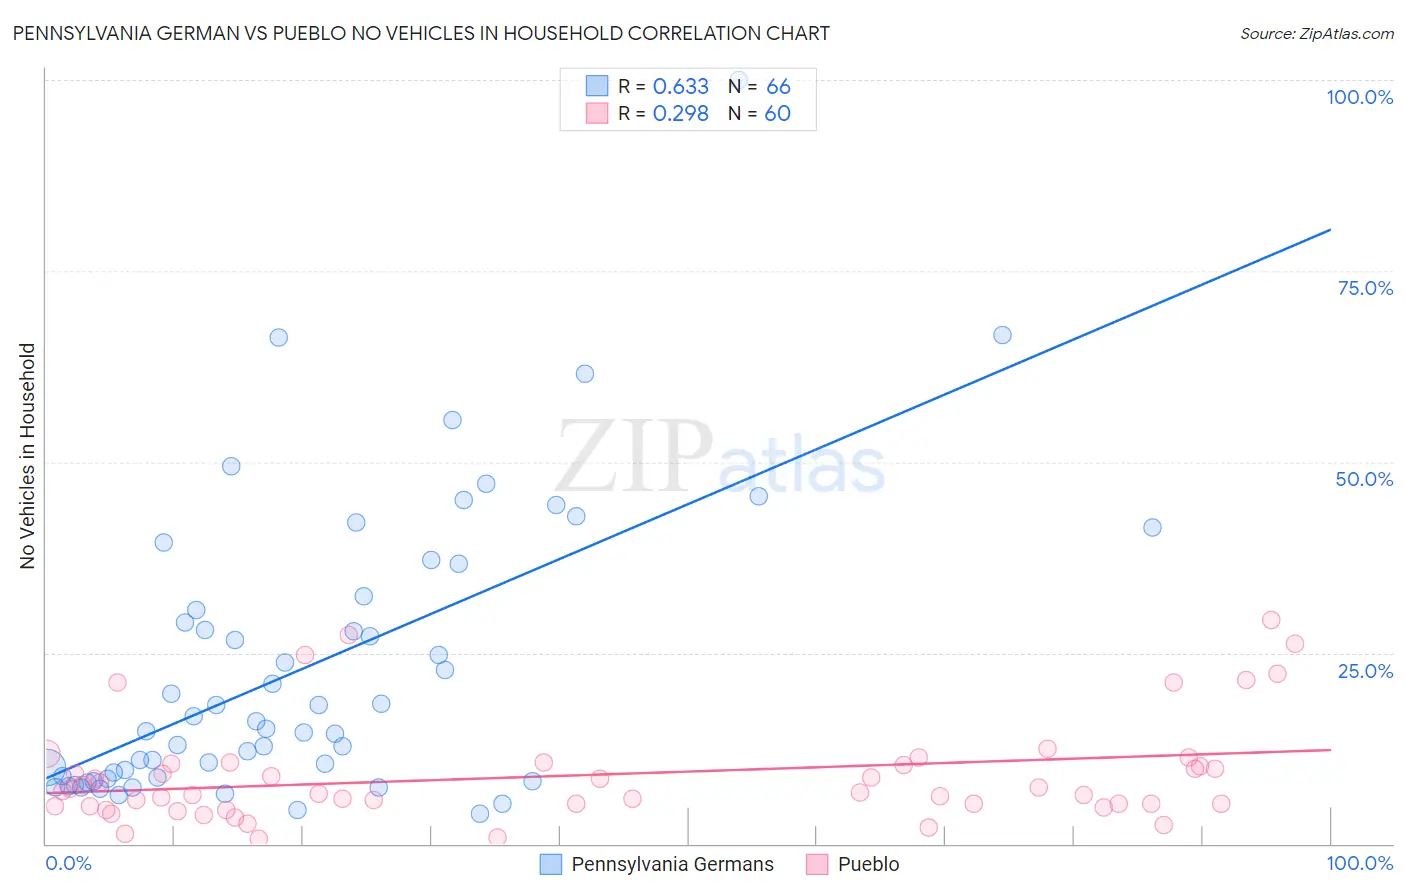
Pennsylvania German vs Pueblo No Vehicles in Household Correlation Chart
The statistical analysis conducted on geographies consisting of 233,622,955 people shows a significant positive correlation between the proportion of Pennsylvania Germans and percentage of households with no vehicle available in the United States with a correlation coefficient (R) of 0.633 and weighted average of 11.0%. Similarly, the statistical analysis conducted on geographies consisting of 120,011,033 people shows a weak positive correlation between the proportion of Pueblo and percentage of households with no vehicle available in the United States with a correlation coefficient (R) of 0.298 and weighted average of 10.8%, a difference of 2.3%.
No Vehicles in Household Correlation Summary
| Measurement | Pennsylvania German | Pueblo |
| Minimum | 4.0% | 0.72% |
| Maximum | 100.0% | 29.3% |
| Range | 96.0% | 28.6% |
| Mean | 23.2% | 9.0% |
| Median | 15.5% | 6.7% |
| Interquartile 25% (IQ1) | 8.7% | 5.1% |
| Interquartile 75% (IQ3) | 32.5% | 10.4% |
| Interquartile Range (IQR) | 23.8% | 5.3% |
| Standard Deviation (Sample) | 19.0% | 6.7% |
| Standard Deviation (Population) | 18.9% | 6.7% |
Demographics Similar to Pennsylvania Germans and Pueblo by No Vehicles in Household
In terms of no vehicles in household, the demographic groups most similar to Pennsylvania Germans are Immigrants from Italy (11.0%, a difference of 0.030%), Sierra Leonean (11.0%, a difference of 0.050%), Immigrants from Chile (11.0%, a difference of 0.10%), Somali (11.0%, a difference of 0.10%), and Guatemalan (11.0%, a difference of 0.14%). Similarly, the demographic groups most similar to Pueblo are Immigrants from Brazil (10.8%, a difference of 0.11%), Ukrainian (10.7%, a difference of 0.17%), Central American (10.8%, a difference of 0.45%), Shoshone (10.8%, a difference of 0.50%), and Immigrants from Sweden (10.8%, a difference of 0.71%).
| Demographics | Rating | Rank | No Vehicles in Household |
| Immigrants | Northern Europe | 33.1 /100 | #191 | Fair 10.7% |
| Carpatho Rusyns | 32.1 /100 | #192 | Fair 10.7% |
| Ukrainians | 28.0 /100 | #193 | Fair 10.7% |
| Pueblo | 27.0 /100 | #194 | Fair 10.8% |
| Immigrants | Brazil | 26.3 /100 | #195 | Fair 10.8% |
| Central Americans | 24.3 /100 | #196 | Fair 10.8% |
| Shoshone | 24.1 /100 | #197 | Fair 10.8% |
| Immigrants | Sweden | 22.9 /100 | #198 | Fair 10.8% |
| Immigrants | Asia | 21.3 /100 | #199 | Fair 10.9% |
| Cambodians | 19.6 /100 | #200 | Poor 10.9% |
| Immigrants | Western Europe | 19.1 /100 | #201 | Poor 10.9% |
| Romanians | 17.9 /100 | #202 | Poor 10.9% |
| Iroquois | 17.6 /100 | #203 | Poor 10.9% |
| Guatemalans | 16.1 /100 | #204 | Poor 11.0% |
| Immigrants | Chile | 15.9 /100 | #205 | Poor 11.0% |
| Somalis | 15.9 /100 | #206 | Poor 11.0% |
| Sierra Leoneans | 15.7 /100 | #207 | Poor 11.0% |
| Immigrants | Italy | 15.6 /100 | #208 | Poor 11.0% |
| Pennsylvania Germans | 15.5 /100 | #209 | Poor 11.0% |
| Apache | 14.8 /100 | #210 | Poor 11.0% |
| Crow | 14.2 /100 | #211 | Poor 11.0% |