Tlingit-Haida vs Immigrants from Switzerland Single Father Households
COMPARE
Tlingit-Haida
Immigrants from Switzerland
Single Father Households
Single Father Households Comparison
Tlingit-Haida
Immigrants from Switzerland
2.7%
SINGLE FATHER HOUSEHOLDS
0.0/ 100
METRIC RATING
289th/ 347
METRIC RANK
2.0%
SINGLE FATHER HOUSEHOLDS
99.9/ 100
METRIC RATING
50th/ 347
METRIC RANK
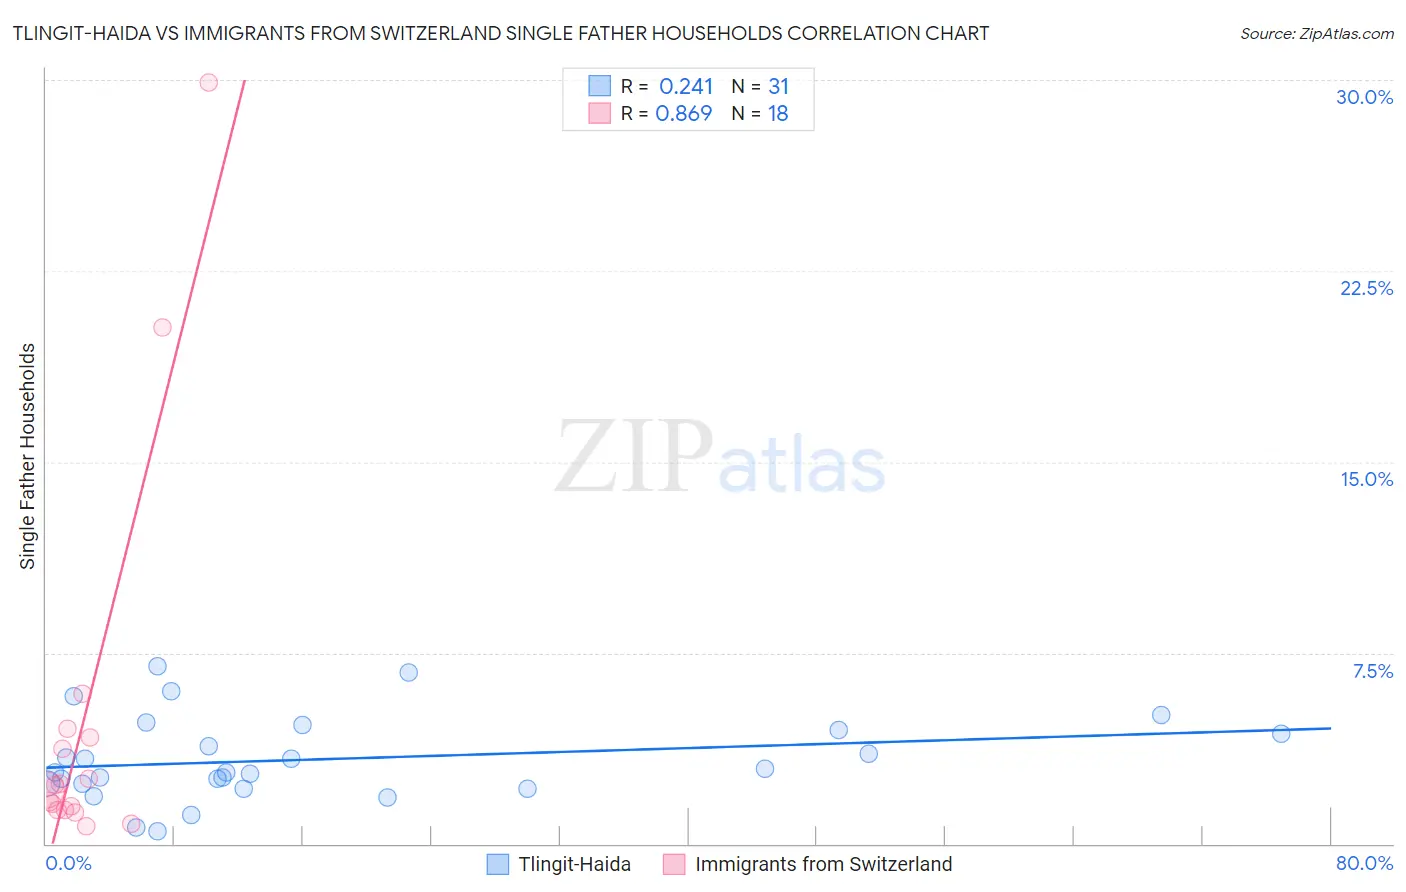
Tlingit-Haida vs Immigrants from Switzerland Single Father Households Correlation Chart
The statistical analysis conducted on geographies consisting of 60,729,668 people shows a weak positive correlation between the proportion of Tlingit-Haida and percentage of single father households in the United States with a correlation coefficient (R) of 0.241 and weighted average of 2.7%. Similarly, the statistical analysis conducted on geographies consisting of 147,445,509 people shows a very strong positive correlation between the proportion of Immigrants from Switzerland and percentage of single father households in the United States with a correlation coefficient (R) of 0.869 and weighted average of 2.0%, a difference of 32.7%.
Single Father Households Correlation Summary
| Measurement | Tlingit-Haida | Immigrants from Switzerland |
| Minimum | 0.49% | 0.69% |
| Maximum | 6.9% | 29.9% |
| Range | 6.5% | 29.2% |
| Mean | 3.3% | 4.9% |
| Median | 2.8% | 2.2% |
| Interquartile 25% (IQ1) | 2.4% | 1.3% |
| Interquartile 75% (IQ3) | 4.5% | 4.2% |
| Interquartile Range (IQR) | 2.1% | 2.8% |
| Standard Deviation (Sample) | 1.6% | 7.7% |
| Standard Deviation (Population) | 1.6% | 7.4% |
Similar Demographics by Single Father Households
Demographics Similar to Tlingit-Haida by Single Father Households
In terms of single father households, the demographic groups most similar to Tlingit-Haida are Immigrants from Cambodia (2.7%, a difference of 0.060%), Central American Indian (2.7%, a difference of 0.31%), Puget Sound Salish (2.7%, a difference of 0.45%), Ottawa (2.7%, a difference of 0.47%), and Immigrants from Cuba (2.7%, a difference of 0.47%).
| Demographics | Rating | Rank | Single Father Households |
| Dutch West Indians | 0.1 /100 | #282 | Tragic 2.6% |
| Immigrants | Nicaragua | 0.1 /100 | #283 | Tragic 2.7% |
| Hawaiians | 0.1 /100 | #284 | Tragic 2.7% |
| Ottawa | 0.1 /100 | #285 | Tragic 2.7% |
| Immigrants | Cuba | 0.1 /100 | #286 | Tragic 2.7% |
| Central American Indians | 0.0 /100 | #287 | Tragic 2.7% |
| Immigrants | Cambodia | 0.0 /100 | #288 | Tragic 2.7% |
| Tlingit-Haida | 0.0 /100 | #289 | Tragic 2.7% |
| Puget Sound Salish | 0.0 /100 | #290 | Tragic 2.7% |
| Blackfeet | 0.0 /100 | #291 | Tragic 2.7% |
| Choctaw | 0.0 /100 | #292 | Tragic 2.7% |
| Immigrants | Fiji | 0.0 /100 | #293 | Tragic 2.7% |
| Malaysians | 0.0 /100 | #294 | Tragic 2.7% |
| Chickasaw | 0.0 /100 | #295 | Tragic 2.8% |
| Japanese | 0.0 /100 | #296 | Tragic 2.8% |
Demographics Similar to Immigrants from Switzerland by Single Father Households
In terms of single father households, the demographic groups most similar to Immigrants from Switzerland are Immigrants from Serbia (2.0%, a difference of 0.0%), Immigrants from Poland (2.0%, a difference of 0.0%), Immigrants from Kazakhstan (2.0%, a difference of 0.020%), Immigrants from Ukraine (2.0%, a difference of 0.040%), and Immigrants from Europe (2.0%, a difference of 0.24%).
| Demographics | Rating | Rank | Single Father Households |
| Immigrants | Grenada | 100.0 /100 | #43 | Exceptional 2.0% |
| Latvians | 100.0 /100 | #44 | Exceptional 2.0% |
| Russians | 100.0 /100 | #45 | Exceptional 2.0% |
| Immigrants | Lebanon | 100.0 /100 | #46 | Exceptional 2.0% |
| Immigrants | Ukraine | 99.9 /100 | #47 | Exceptional 2.0% |
| Immigrants | Kazakhstan | 99.9 /100 | #48 | Exceptional 2.0% |
| Immigrants | Serbia | 99.9 /100 | #49 | Exceptional 2.0% |
| Immigrants | Switzerland | 99.9 /100 | #50 | Exceptional 2.0% |
| Immigrants | Poland | 99.9 /100 | #51 | Exceptional 2.0% |
| Immigrants | Europe | 99.9 /100 | #52 | Exceptional 2.0% |
| Immigrants | Northern Europe | 99.9 /100 | #53 | Exceptional 2.0% |
| Immigrants | Korea | 99.9 /100 | #54 | Exceptional 2.0% |
| Immigrants | France | 99.9 /100 | #55 | Exceptional 2.0% |
| Immigrants | Norway | 99.9 /100 | #56 | Exceptional 2.0% |
| Burmese | 99.9 /100 | #57 | Exceptional 2.0% |