Tlingit-Haida vs Kiowa 2 or more Vehicles in Household
COMPARE
Tlingit-Haida
Kiowa
2 or more Vehicles in Household
2 or more Vehicles in Household Comparison
Tlingit-Haida
Kiowa
55.8%
2 OR MORE VEHICLES IN HOUSEHOLD
68.5/ 100
METRIC RATING
158th/ 347
METRIC RANK
53.9%
2 OR MORE VEHICLES IN HOUSEHOLD
6.2/ 100
METRIC RATING
222nd/ 347
METRIC RANK
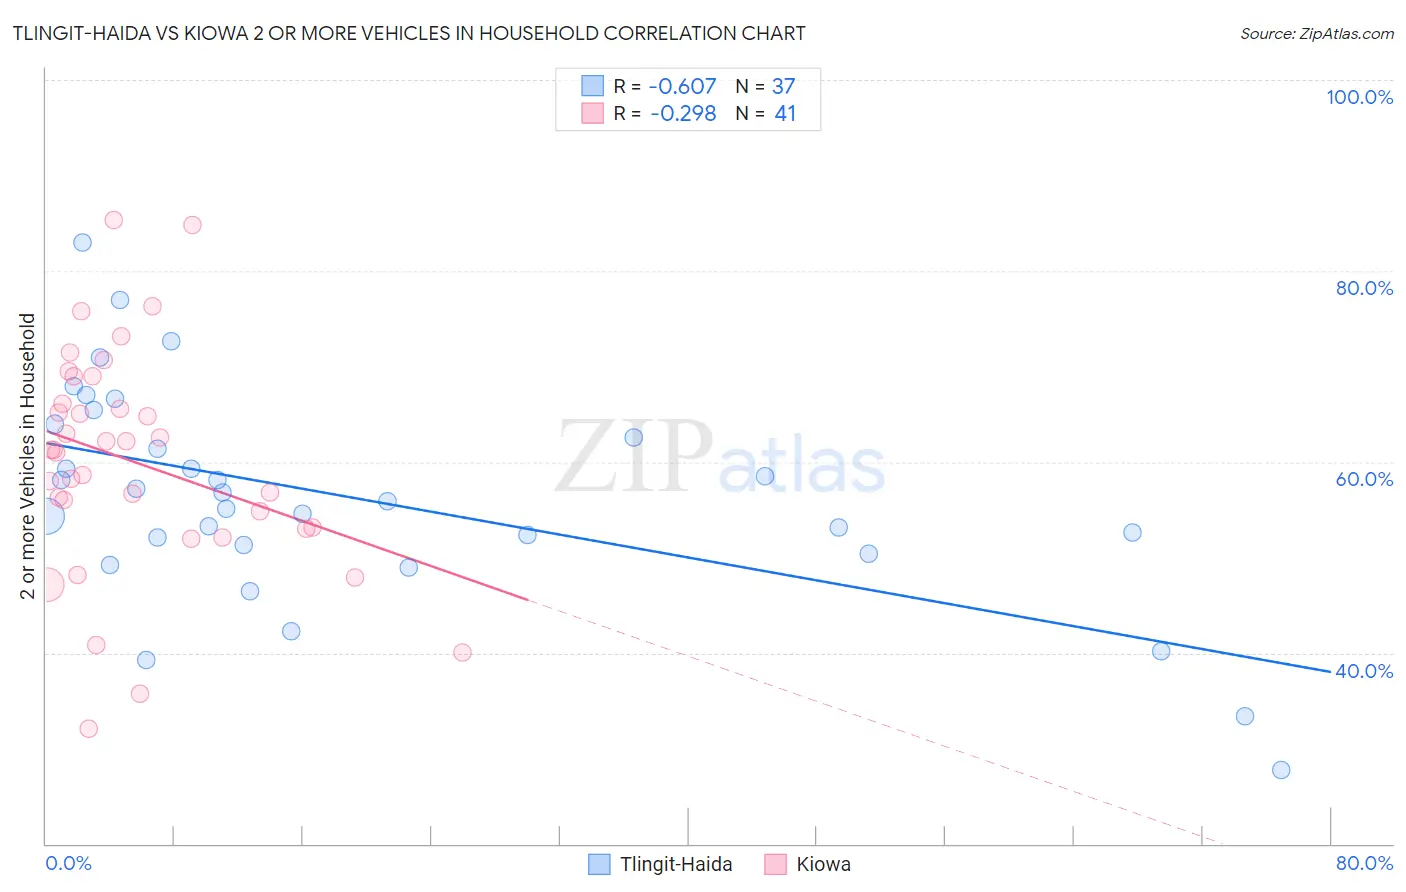
Tlingit-Haida vs Kiowa 2 or more Vehicles in Household Correlation Chart
The statistical analysis conducted on geographies consisting of 60,853,675 people shows a significant negative correlation between the proportion of Tlingit-Haida and percentage of households with 2 or more vehicles available in the United States with a correlation coefficient (R) of -0.607 and weighted average of 55.8%. Similarly, the statistical analysis conducted on geographies consisting of 56,099,396 people shows a weak negative correlation between the proportion of Kiowa and percentage of households with 2 or more vehicles available in the United States with a correlation coefficient (R) of -0.298 and weighted average of 53.9%, a difference of 3.6%.
2 or more Vehicles in Household Correlation Summary
| Measurement | Tlingit-Haida | Kiowa |
| Minimum | 27.8% | 32.0% |
| Maximum | 83.0% | 85.3% |
| Range | 55.2% | 53.2% |
| Mean | 56.2% | 60.1% |
| Median | 55.8% | 61.2% |
| Interquartile 25% (IQ1) | 50.8% | 53.1% |
| Interquartile 75% (IQ3) | 63.2% | 67.5% |
| Interquartile Range (IQR) | 12.4% | 14.5% |
| Standard Deviation (Sample) | 11.4% | 11.7% |
| Standard Deviation (Population) | 11.2% | 11.6% |
Similar Demographics by 2 or more Vehicles in Household
Demographics Similar to Tlingit-Haida by 2 or more Vehicles in Household
In terms of 2 or more vehicles in household, the demographic groups most similar to Tlingit-Haida are Paiute (55.8%, a difference of 0.020%), Crow (55.7%, a difference of 0.070%), Immigrants from Kuwait (55.8%, a difference of 0.080%), Immigrants from Lithuania (55.8%, a difference of 0.090%), and Ukrainian (55.8%, a difference of 0.10%).
| Demographics | Rating | Rank | 2 or more Vehicles in Household |
| Immigrants | Northern Europe | 78.7 /100 | #151 | Good 56.1% |
| Immigrants | Pakistan | 78.1 /100 | #152 | Good 56.1% |
| Lumbee | 71.9 /100 | #153 | Good 55.9% |
| Ukrainians | 70.8 /100 | #154 | Good 55.8% |
| Immigrants | Venezuela | 70.7 /100 | #155 | Good 55.8% |
| Immigrants | Lithuania | 70.4 /100 | #156 | Good 55.8% |
| Immigrants | Kuwait | 70.2 /100 | #157 | Good 55.8% |
| Tlingit-Haida | 68.5 /100 | #158 | Good 55.8% |
| Paiute | 68.0 /100 | #159 | Good 55.8% |
| Crow | 67.0 /100 | #160 | Good 55.7% |
| Colville | 61.1 /100 | #161 | Good 55.6% |
| German Russians | 60.9 /100 | #162 | Good 55.6% |
| Immigrants | Zimbabwe | 60.2 /100 | #163 | Good 55.6% |
| Dutch West Indians | 59.8 /100 | #164 | Average 55.6% |
| Immigrants | El Salvador | 59.4 /100 | #165 | Average 55.6% |
Demographics Similar to Kiowa by 2 or more Vehicles in Household
In terms of 2 or more vehicles in household, the demographic groups most similar to Kiowa are Immigrants from Singapore (53.9%, a difference of 0.010%), Taiwanese (53.9%, a difference of 0.030%), South American Indian (53.9%, a difference of 0.050%), Immigrants from Argentina (53.9%, a difference of 0.11%), and Immigrants from Bosnia and Herzegovina (53.8%, a difference of 0.13%).
| Demographics | Rating | Rank | 2 or more Vehicles in Household |
| Aleuts | 9.3 /100 | #215 | Tragic 54.1% |
| Immigrants | Western Asia | 9.3 /100 | #216 | Tragic 54.1% |
| Immigrants | Burma/Myanmar | 7.1 /100 | #217 | Tragic 53.9% |
| Immigrants | Argentina | 6.8 /100 | #218 | Tragic 53.9% |
| South American Indians | 6.5 /100 | #219 | Tragic 53.9% |
| Taiwanese | 6.3 /100 | #220 | Tragic 53.9% |
| Immigrants | Singapore | 6.3 /100 | #221 | Tragic 53.9% |
| Kiowa | 6.2 /100 | #222 | Tragic 53.9% |
| Immigrants | Bosnia and Herzegovina | 5.5 /100 | #223 | Tragic 53.8% |
| Brazilians | 5.3 /100 | #224 | Tragic 53.8% |
| Immigrants | Egypt | 5.2 /100 | #225 | Tragic 53.8% |
| Immigrants | Eastern Africa | 5.1 /100 | #226 | Tragic 53.7% |
| Sudanese | 4.1 /100 | #227 | Tragic 53.6% |
| Alaska Natives | 3.9 /100 | #228 | Tragic 53.6% |
| Immigrants | Turkey | 3.8 /100 | #229 | Tragic 53.6% |